
Figure 9.
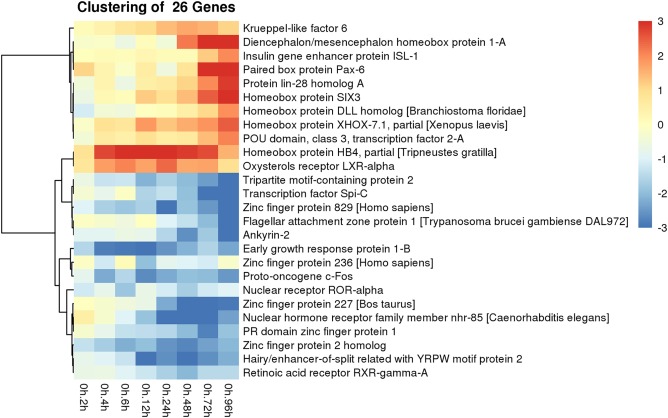
Differential gene expression of putative transcription factors in regenerating P. flava. A heatmap showing the identity and expression profile of all transcription factors that were both up and down‐regulated across all time points sampled compared with control animals.