
Figure 2.
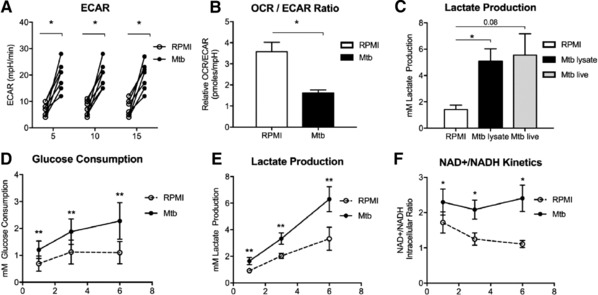
Physiology of the PBMC metabolic response to Mtb stimulation. (A, B) CD14+ monocytes were stimulated for 24 h with Mtb and (A) ECAR and (B) OCR rates were determined using the Seahorse metabolic analyzer. Three baseline measurements were determined. Data are shown as means ± SEM (n = 7). (C) Lactate production from macrophages stimulated with live H37Rv (10:1 MOI) was measured by a fluorescent coupled enzymatic assay. Data are shown as means ± SEM of n = 4, pooled from two independent experiments. (D‐F) PBMCs were stimulated with Mtb lysate and the kinetics of (D) glucose consumption, (E) lactate production and (F) the intracellular NAD+/NADH ratios from days 1, 3 and 7 was measured by metabolite specific coupled enzymatic assays. Data are shown as means ± SEM of n = 6 to 8, pooled from three independent experiments. Means were compared using the Wilcoxon signed‐rank test, *p < 0.05).