
Figure 3.
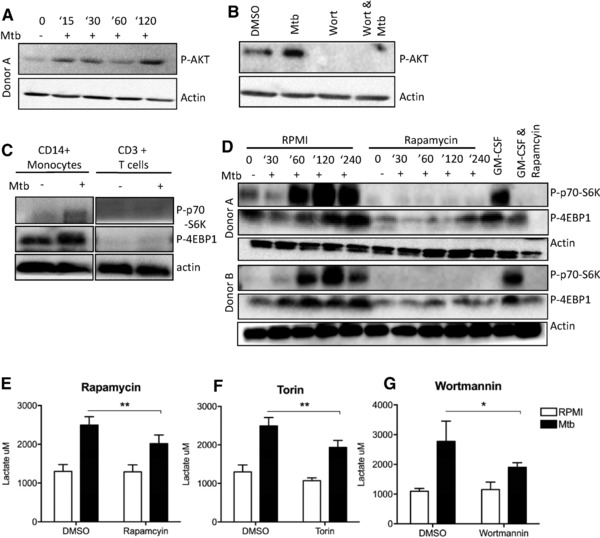
Induction of glycolysis in human PBMCs is mediated by the AKT‐mTOR pathway. (A–D) PBMCs were stimulated with RPMI or Mtb in a time‐dependent manner in the presence or absence of DMSO (vehicle control), wortmannin (PI3K/AKT inhibitor), or rapamycin (mTOR inhibitor). (C) CD14+ and CD3+ T cells were separated from PBMCs stimulated for 2 h with Mtb. Where indicated, GM‐CSF stimulation was included as a positive control. (A, B) AKT, (C, D) p70‐S6K and 4E‐BP1 phosphorylation and actin levels were determined by Western blot using specific antibodies. (A, B) Cell lysates were harvested at 15, 30, 60, and 120 min poststimulation. (C, D) Cell lysates were harvested at 30, 60, 120, and 240 min poststimulation. Representative blots from two of four donors are shown. (E–G) PBMCs were preincubated with 10 nM rapamycin, 100 nM torin, or 100 nM wortmannin for 1 h prior to stimulation with Mtb lysate. Data are shown as means ± SEM of n = 9, pooled from three independent experiments. Means were compared using the Wilcoxon signed‐rank test (*p < 0.05, **p < 0.01).