
Figure 5.
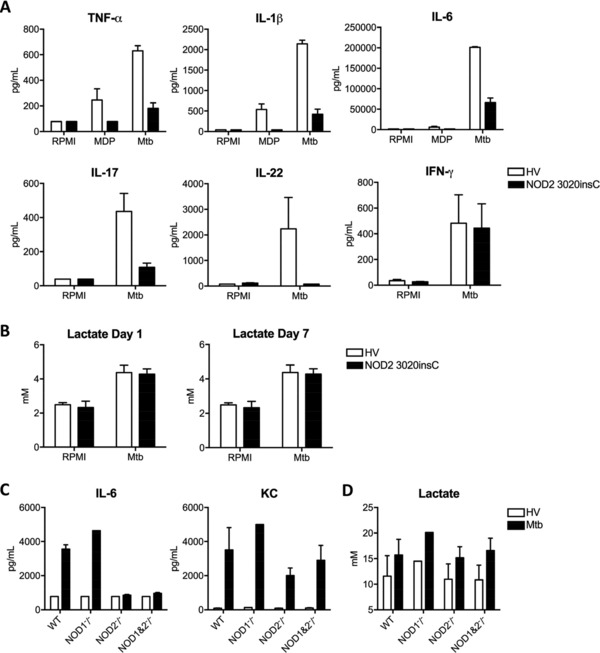
Role of NOD2 in the induction of glycolysis. (A, B) PBMCs from NOD2‐deficient patients (n = 2) and healthy volunteers (n = 4) were stimulated with RPMI, MDP, and Mtb for 24 h and 7 days. The levels of (A) indicated cytokines or (B) lactate production were measured from culture supernatants by ELISA and an enzymatic couple assay, respectively. Data are shown as means ± SEM of the indicated number of donor samples and are from a single experiment. (C, D) BMDMs from WT, NOD1 knockout (−/−), NOD2 knockout (−/−), and NOD 1/2 double knockout (−/−) mice were stimulated with RPMI or 1 μg/mL Mtb lysate for 24 h (n = 2). The levels of (C) IL‐6 and KC and (D) lactate production were measured as described above. Data are shown as means ± SEM of n = 2 from a single experiment.