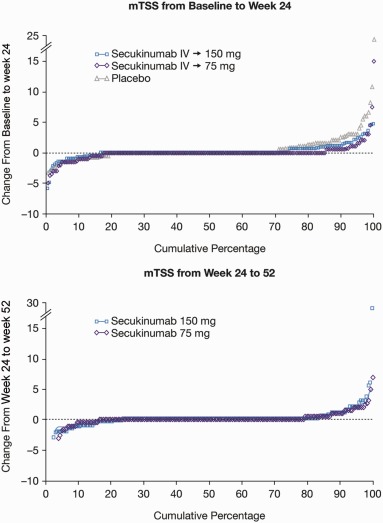
Figure 2.

Cumulative probability plots of mean changes in the modified total Sharp/van der Heijde score (SHS; mTSS). Top, Mean changes from baseline to week 24 in patients receiving intravenous (IV) secukinumab followed by subcutaneous secukinumab at a dose of 150 mg (IV→150 mg) or 75 mg (IV→75 mg) and placebo‐treated patients. Data are for the full analysis set, with linear extrapolation for all patients who underwent radiographic assessment at week 16. Bottom, Mean changes from week 24 to week 52 in patients receiving secukinumab. Data are for radiography completers (patients who had radiographic assessments at baseline, week 16 or 24, and week 52), with no extrapolation applied.
