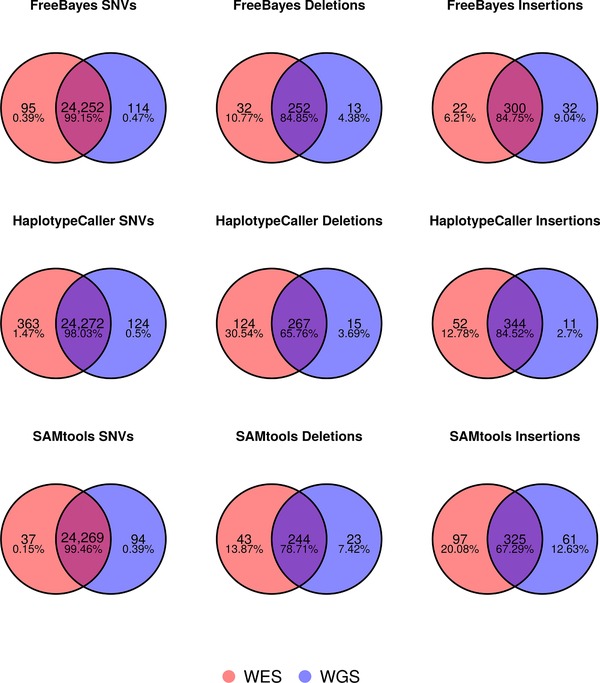
Figure 3.

Venn diagrams illustrating concordance of WGS and WES variant identification. Separate Venn diagrams show the number and percentage of concordant calls for a particular variant type for the GEM3 pipelines for variants identified in the intersection of the NIST reliably callable region and exome capture regions (∼34.7 MB). SNVs, single nucleotide variants.
