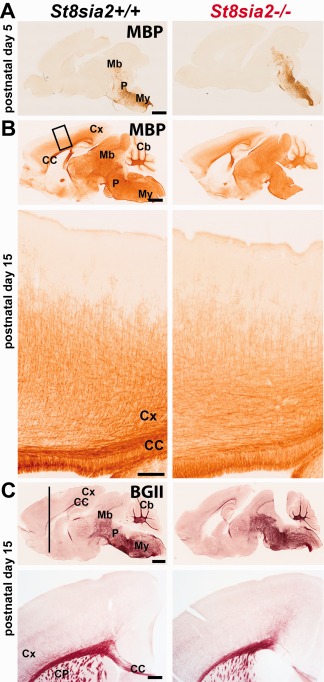
Figure 2.

Progression of brain myelination in wildtype and St8sia2 −/− mice during postnatal development. A, B: Immunohistochemical staining for MBP on sagittal brain sections on P5 and P15. C: Histological Black Gold II staining of brain sections on P15. Representative sections of one of four brains are shown for each genotype. Scale bar: 1000 μm in upper panels and 100 μm in bottom panels. Cb, cerebellum; CC, corpus callosum; CP, caudate putamen; Cx, cortex; Mb, midbrain; My, medulla; P, pons. [Color figure can be viewed at wileyonlinelibrary.com]
