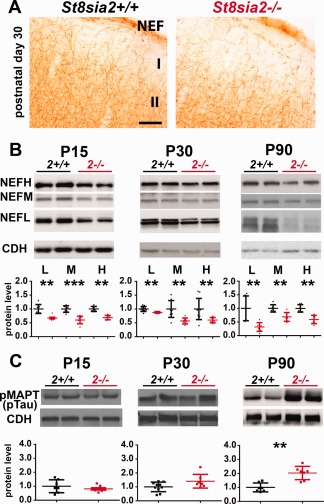
Figure 4.

The levels of Neurofilament and the axonal degeneration marker pMAPT in the cortex in wildtype and St8sia2 −/− mice. A: Immunohistochemical staining for NEF on coronal brain sections on P30. n = 4. B: Representative Western blots and (C) densitometric analyses of NEF isoforms and pMAPT (pTAU) in the cortex in St8sia2+/+ and St8sia2 −/− mice on P15, P30, and P90. The band intensity was normalized to pan‐Cadherin (CDH). Each dot represents one animal. The mean for the control is set as 1. The data are expressed as mean ± SD. I, molecular layer of cortex; II, external granular layer of cortex. **P ≤ 0.01; ***P ≤ 0.001. [Color figure can be viewed at wileyonlinelibrary.com]
