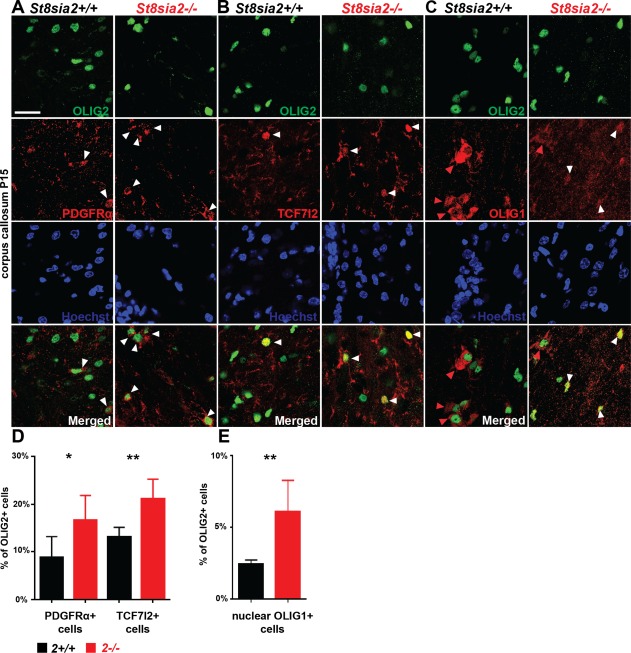
Figure 7.

Expression of differentiation markers in oligodendroglial in the corpus callosum in juvenile wildtype and St8sia2 −/− mice. A−C: Representative photographs of the corpus callosum on coronal brain sections of St8sia2+/+ and St8sia2 −/− mice on P15. Slices were stained for OLIG2 (green) and PDGFRα (red, A), TCF7l2 (red, B) or OLIG1 (red, C). Cell nuclei were counterstained with Hoechst (blue). White arrowheads point to PDGFRα+ cells, TCF7l2+ cells, or cell with nuclear localization of OLIG1. Red arrowheads point to cell with cytosolic localization of OLIG1. Scale bar = 25 µm. D: Quantification of OLIG2+/PDGFRα+ cells (left panel) and OLIG2+/TCF7l2+ cells (right panel). E: Quantification of OLIG2+ cells expressing nuclear OLIG1. n = 6. The data are expressed as mean ± SD. *P ≤ 0.05; **P ≤ 0.01. [Color figure can be viewed at wileyonlinelibrary.com]
