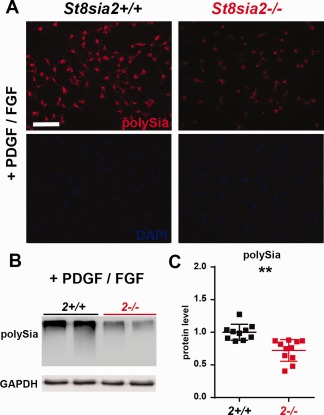
Figure 8.

Levels of polySia in wildtype and St8sia2 −/− OPCs in vitro. A: Immunofluorescence analysis of polySia in OPCs cells in vitro. The cells were labeled with anti‐polySia antibody (red), and the nuclei were counterstained with DAPI. Representative photographs of St8sia2+/+ and St8sia2 −/− OPCs from one of three experiments are shown. Scale bar = 50 μm. B: Representative Western blots and (C) densitometric analyses of polySia levels in protein extracts from OPCs cultured in medium supplemented with PDGF‐AA/bFGF. The band intensity was normalized to glyceraldehyde 3‐phosphate dehydrogenase (GAPDH). Each dot represents one independent OPC culture. The mean for the control is set as 1. The data are expressed as mean ± SD. **P ≤ 0.01. [Color figure can be viewed at wileyonlinelibrary.com]
