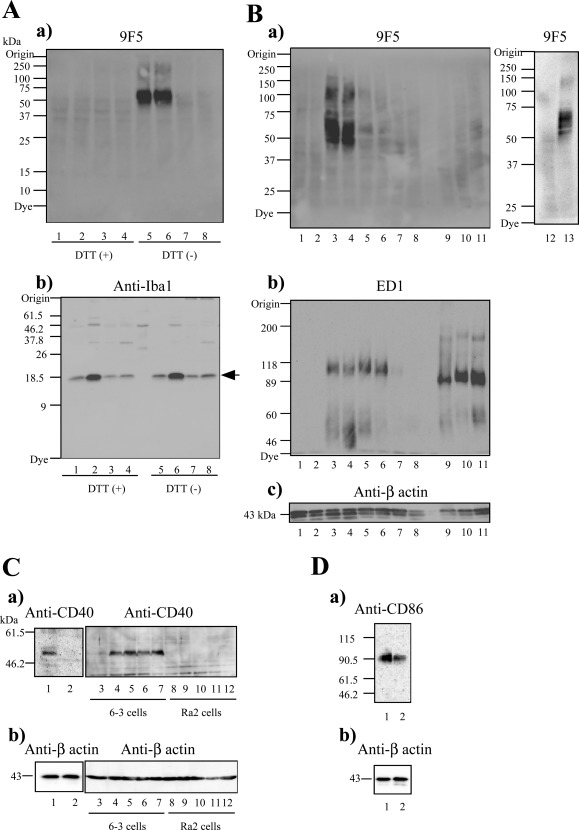
Figure 1.

Analysis of 9F5 selectivity for rat type 1 microglia (MG) by Western blot (WB) analysis. A: WB analyses with 9F5 (a) and anti‐Iba1 antibody (b) under DTT (+) (lanes 1–4) and DTT (−) (lanes 5–8) conditions. Cell extracts (20 µg) were from rat type 1 MG (lanes 1, 5), lipopolysaccharide (LPS)‐stimulated rat type 1 MG (lanes 2, 6), rat type 2 MG (lanes 3, 7), and interleukin (IL)−4‐stimulated rat type 2 MG (lanes 4, 8). B: WB analyses with 9F5(a), ED1 (b), and anti‐β‐actin (c) antibodies under DTT (−) conditions. Extracts (20 µg) were from mouse 6‐3 MG (lane 1), mouse Ra2 MG (lane 2), rat type 1 MG (lanes 3, 13), LPS‐stimulated rat type 1 MG (lane 4), rat type 2 MG (lane 5), IL‐4‐stimulated rat type 2 MG (lane 6), rat neurons (lane 7), astrocytes (lane 8), peritoneal rat macrophages (Mφ) (lane 9), LPS‐stimulated peritoneal rat Mφ (lane 10), thioglycolate‐elicited rat Mφ (lane 11), and rat neuroepithelial cells (lane 12). C, D: WB analyses with anti‐CD40 (Ca), anti‐CD86 (Da), or anti‐β‐actin (Cb, Db) antibodies. Extracts (40 µg) were from rat type 1 MG (lane 1) or rat type 2 MG (lane 2).Cell extracts from 6‐3 and Ra2 were used as positive and negative controls for immunoblotting with anti‐CD40 antibody. The 6–3 and Ra2 cells were treated with LPS [0 µg ml−1 (lane 3, 8), 0.01 µg ml−1 (lane 4, 9), 0.1 µg ml−1 (lane 5, 10), 1 µg ml−1 (lane 6, 11), and 10 µg ml−1 (lane 7, 12)] for 12 hr.
