Figure 13.

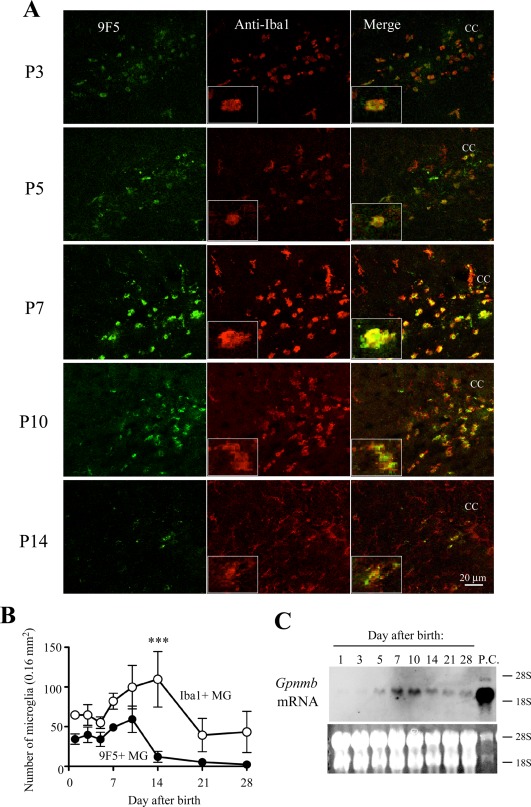
Comparative immunofluorescence analysis of cryostat sections from postnatal rat brains with 9F5 and anti‐Iba1antibodies. A: Coronal sections from P3‐P14 brains were probed with 9F5 (green) and anti‐Iba1 (red) antibodies. Fluorescencesignals are shown individually and after merging. Inset shows a higher magnification of double‐labeled cells. Labeled cells are concentrated in the white matter that constitutes the stream around the corpus callosum (CC). B: Plots of the number of Iba1+ MG and 9F5+ MG (9F5 + Iba1+ cells) in the developing brains from P1 to P28. Data are means ± SEM (n = 3). ***P < 0.001 (at day 14), determined by two‐way ANOVA with the Bonferroni post hoc test. C: Samples of total RNA (10 µg) from rat brain (P1 to P28) were subjected to blot analysis for Gpnmb mRNA. The positive control (P.C.) was total RNA (2.0 µg) from MG5 cells. The bottom panel shows ethidium bromide staining of 28S and 18S rRNA. [Color figure can be viewed in the online issue, which is available at wileyonlinelibrary.com.]
