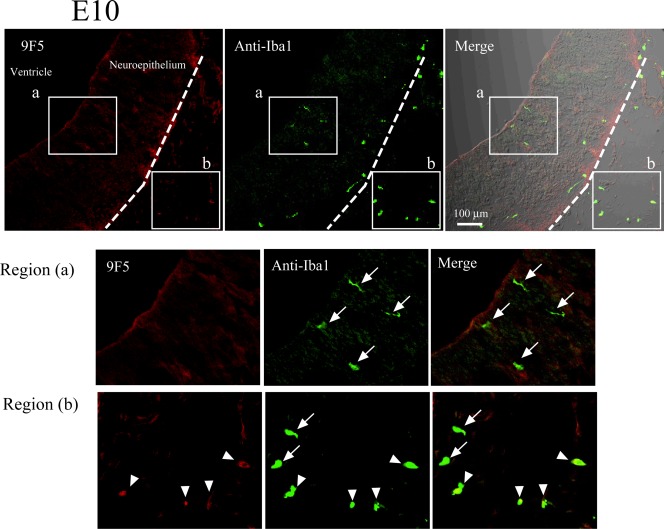
Figure 14.

Immunofluorescence analysis of cryostat sections of E10 rat brain. Coronal sections of E10 rat brains were probed with 9F5 (red) and anti‐Iba1(green) antibodies. Fluorescence signals are shown individually and after merging. The 9F5+ cells and Iba1+ cells are shown at higher magnification (regions a, b). Iba1 + 9F5− cells (arrows) occurred inside and outside the neural tube of the E10 rat brain, whereas 9F5 + Iba1+ cells (arrowheads) were observed outside the neural tube at this stage. [Color figure can be viewed in the online issue, which is available at wileyonlinelibrary.com.]
