Figure 3.

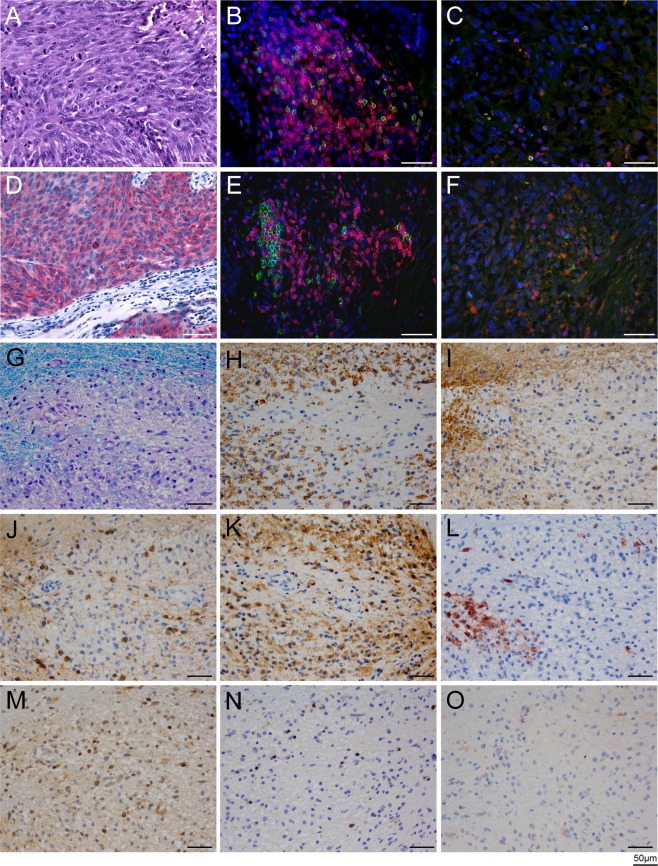
Histology of the primary melanoma (A–F) and active demyelinating multiple sclerosis (MS) lesion (G–O). (A–F) Hematoxylin and eosin staining of the primary melanoma is shown in A. Melanoma cells exhibit strong cytoplasmic staining for Melan‐A (D). Double‐stainings for CD3 (red) and CD8 (green; B, C), and double staining for CD3+ (red) and CD20 (green; E, F) show infiltration of immune cells into the epidermis (B, E), as well as scattered T and B cells in the tumor (C, F). The ratios of total (CD3+) T cells to cytotoxic (CD8+) T cells, and total (CD3+) T cells to CD20+ B cells, were 3.4:1 and 3:1, respectively. Nuclei are stained in blue with DAPI. (G–O) Brain biopsy specimen of active demyelinating MS lesion. Region of active demyelination with numerous foamy macrophages containing myelin debris (G, stained with Luxol fast blue/periodic acid–Schiff; H, stained for myelin proteolipid protein) is shown. The foamy macrophages also contained fragments of myelin oligodendrocyte glycoprotein (I). J shows Nogo A–positive, viable oligodendrocytes in the demyelinated area; K shows dense infiltration of foamy macrophages and activated microglia with KiM1P immunohistochemistry. Some foamy macrophages are positive for the early macrophage activation marker MRP14 (L). Scattered CD3+ T cells are present in the demyelinated area (M); most infiltrating T cells are CD8+ (N). The foamy macrophages stain negative for complement C9neo, as is typical for pattern 1 MS lesions10 (O). All scale bars represent 50 μm.
