
Fig. 4.
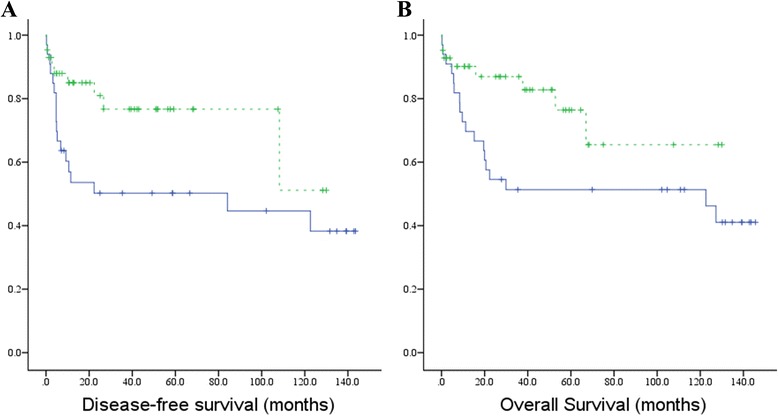
Kaplan-Meier survival curves for wtERa in cohort P. Using the median value as cutoff, cohort P was divided into two groups: each group with 38 cases. a Disease-free survival, b Overall survival (Blue dotted line, low expression; Green dotted line, high expression; Vertical axis, survival function)