
Fig. 1.
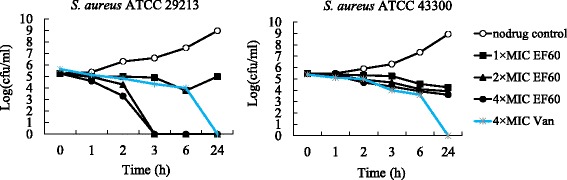
Time-kill curves for Staphylococcus aureus ATCC 29213 and 43300. Each data point reflects the average of two independent measurements. The curves are viable cell concentrations plotted against time. Open circles, nondrug control; closed squares, 1× MIC of EF60; closed triangles, 2× MIC of EF60; closed circles, 4× MIC of EF60; asterisk, 4× MIC of vancomycin. MIC, minimum inhibitory concentration