
Fig. 4.
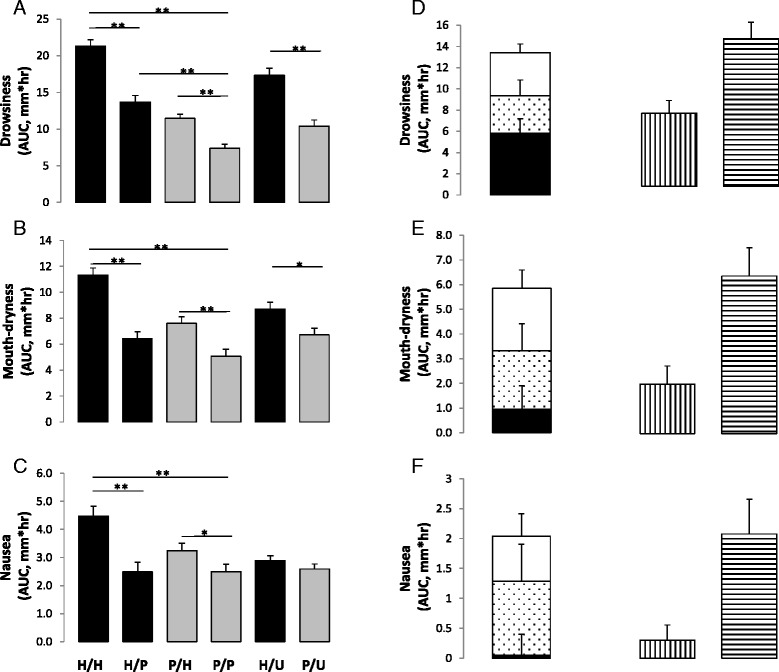
Mean Area-Under-the-Curve According to Intervention or Type of Effect. a to c adjusted mean area-under-the-curve after receiving 25 mg hydroxyzine (black bars), described as hydroxyzine (H/H), as placebo (H/P), or as unknown (H/U); or placebo (grey bars), described as hydroxyzine (P/H), as placebo (P/P), or as unknown (P/U). d to f adjusted interaction model-estimated drug effect (black bars), drug*placebo interaction effect (dotted bars), placebo effect (white bars), conventionally estimated drug effect (vertical strips bars), and total effect (horizontal strips bars). T-bars indicate standard errors. * p <0.05, ** p <0.001