
Fig. 2.
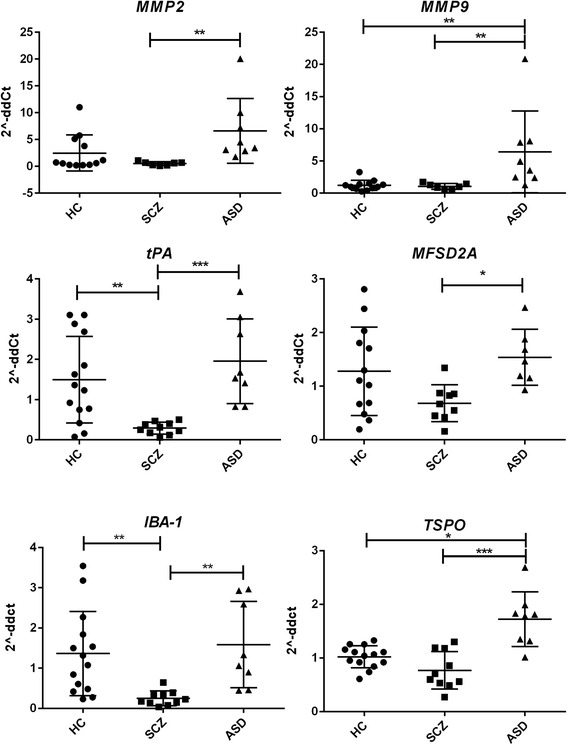
Gene expression profile of BBB function associated components in the cortex of HC, ASD, and SCZ subjects. Each dot represents data from a single subject. Gene expression level is reported as 2−ddCT with normalization of mRNA expression to the endogenous control 18S. Mean ± SEM are reported for each group. One-way ANOVA test has been used to evaluate statistical significance. *p < 0.05; **p < 0.01; ***p < 0.001