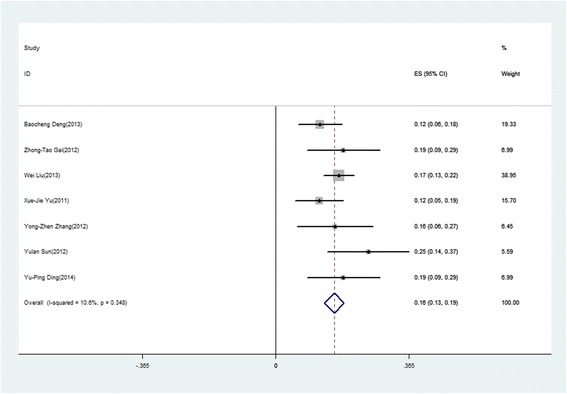
Fig. 1.

Forest plot of case fatality rate for SFTS patients. The point estimates from each study were shown as solid squares. The pooled estimates were shown as an empty diamond. Error bars represented 95% CIs. (Reference No. [32] and No. [33] were excluded because they did not mention the fatality rate)
