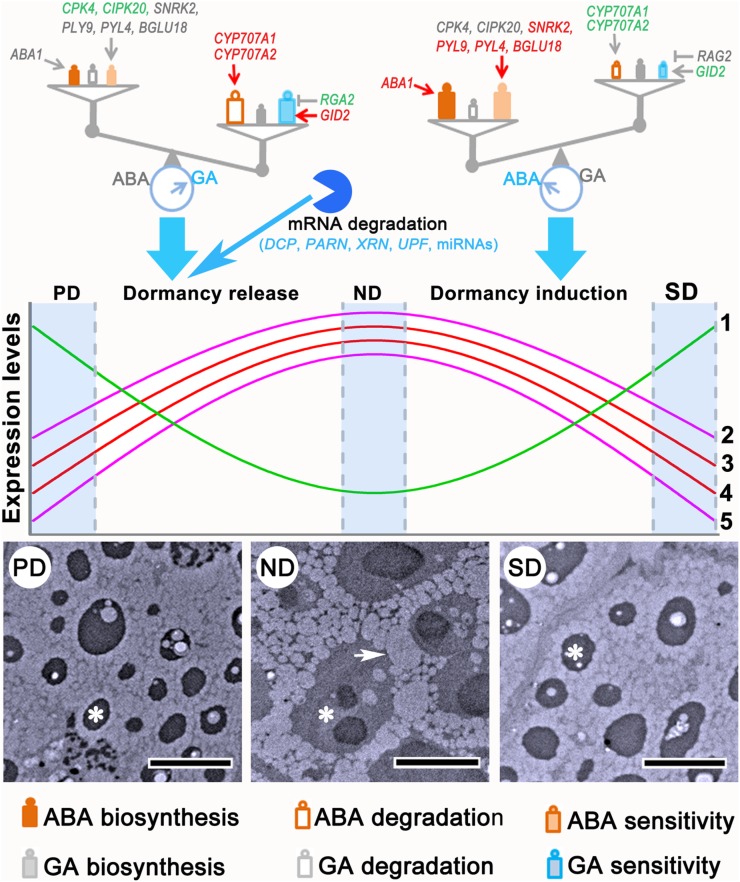
Figure 11.
Diagram of the universal regulatory mechanisms of physiological dormancy and differences between primary and secondary dormancy. Environmental cues are sensed by the seeds and may disturb the existing ABA/GA balance, which opens the door for dormancy release or induction. The reversible changes in gene expression and cytology provide a basis for dormancy cycling. mRNA degradation mediated by DCPs, PARN, XRN, UPFs, and miRNAs also contributes to transcriptional regulation of gene expression during primary dormancy release. Colors of gene names in the ABA/GA balance diagram indicate different gene expression patterns. Red, green, and gray indicate increased, reduced, and stable expression, respectively. Group 1 genes are those regulating cell wall biogenesis, including CSL, CES, KOR, 4CLL10, and GAUT; Group 2, genes regulating transcription initiation and elongation and translation initiation, including TFIIs, eIFs, and SPT; Group 3, genes regulating respiration, including ACO, CSY, DLST, and FUM; Group 4, genes regulating cell cycle and division, including CYC, CDC, and CUL; Group 5, genes regulating cell wall degradation, including XYN and genes encoding β-glucosidase and pectase lyases. The transmission electron microscopy images are fitted from Figure 3, C to E. The asterisks in the transmission electron microscopy images indicate protein bodies, and the arrow indicates an oleosome. Bars in the transmission electron microscopy images represent 5 μm.

