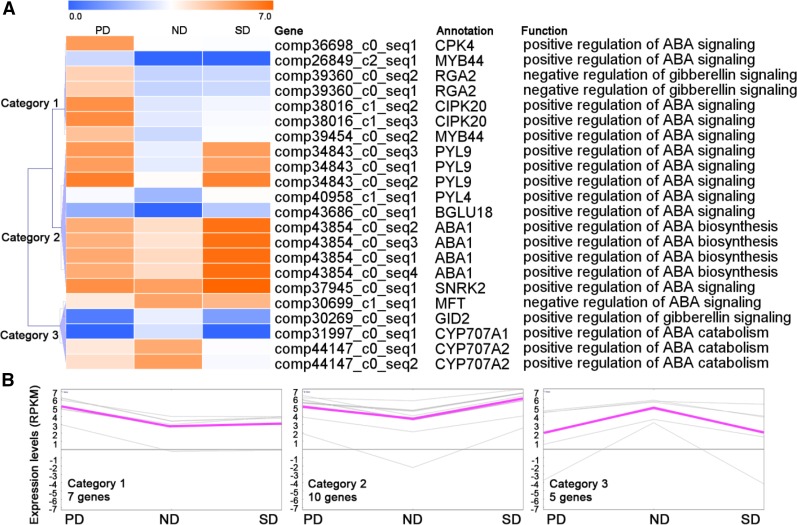
Figure 5.
Expression profiles of genes involved in the regulation of biosynthesis, catabolism, and sensitivity to GA and ABA. A, Hierarchical cluster analysis grouped the DEGs associated with GA and ABA into three categories. B, Gene expression patterns in each category. The expression levels of genes (RPKM), based on RNA-seq, were log2 transformed and color-coded (blue, low expression levels; orange, high expression levels).

