Figure 8.
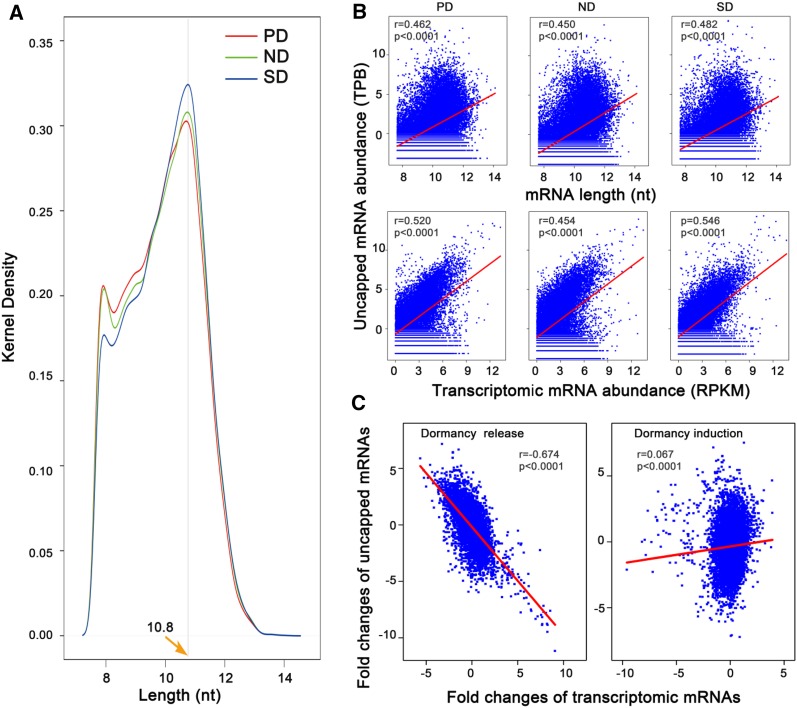
Characterization of uncapped mRNA expression in C. lanceolata seeds. A, Length distribution of mRNAs with uncapped decay products. The y axis shows the relative frequency of mRNA species detected in the uncapped form. B, Correlations between uncapped mRNA abundance and transcriptomic mRNA length and abundance. The three upper panels show correlations between expression levels of uncapped mRNAs and transcriptomic mRNA length, and the lower three show correlations between expression levels of uncapped mRNAs and transcriptomic mRNA abundance in PD, ND, and SD seeds. C, Correlation between fold changes of uncapped mRNAs and those of transcriptomic mRNAs. A close negative correlation was found between fold changes of uncapped mRNAs and that of transcriptomic mRNAs during the release of primary dormancy (left), but a loose correlation was detected during secondary dormancy induction (right). Data for gene expression levels and mRNA length were log2 transformed.

