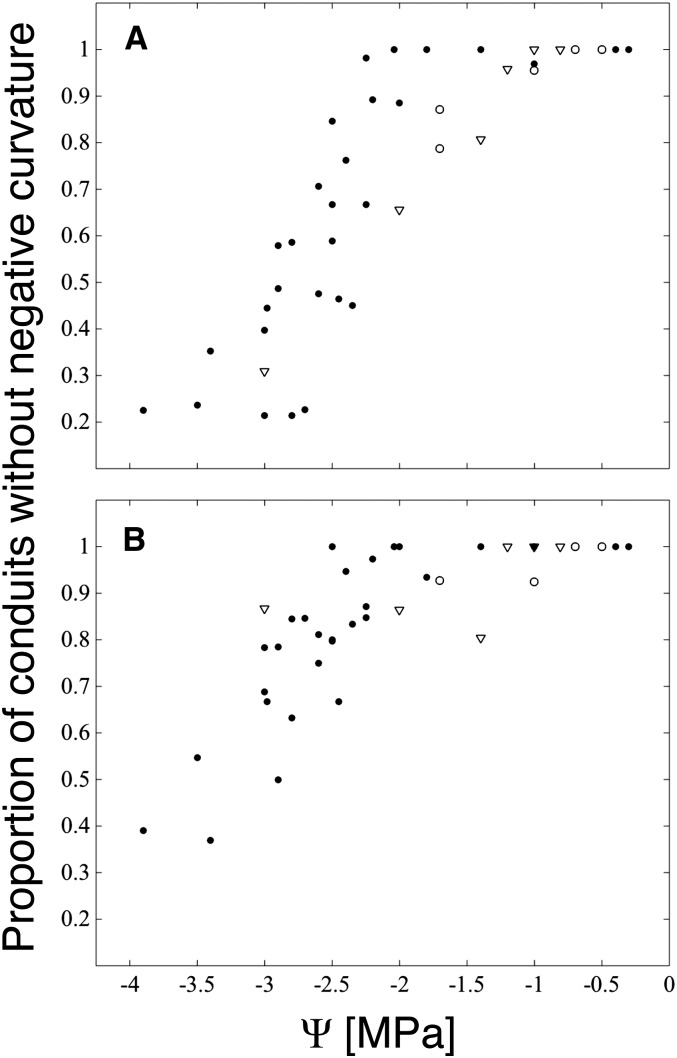
Figure 3.
Proportion of conduits whose perimeters lack instances of negative (concave) curvature. A, Intrusive veins (type I). B, Boundary veins (type B). Scores for each leaf sample imaged are plotted at the parent branch water potential (black circles) or for rehydrated leaves at the final equilibrium water potential (white circles; initial Ψ = −3.5 to −2.7) and at the predicted final equilibrium water potential for leaves frozen immediately after rehydration (white triangles; initial Ψ = −3.5 to −2.5 MPa).

