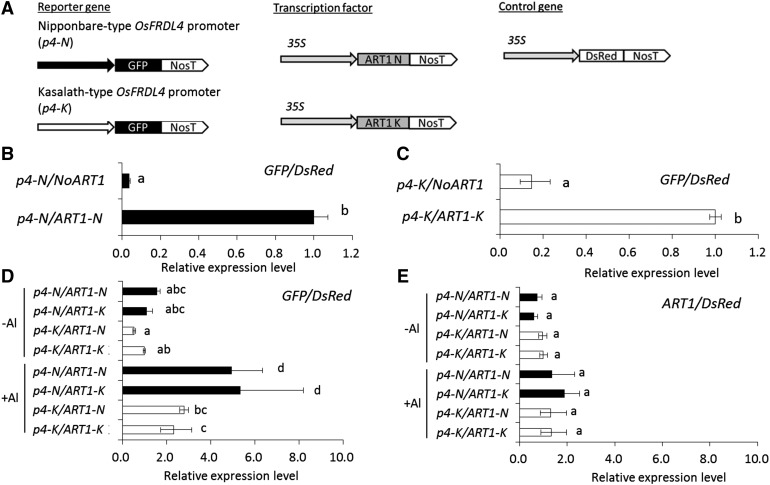
Figure 4.
Promoter activity assay in tobacco cultured cell protoplasts. A, Schematic diagram of the reporter, transcriptional factor, and internal control plasmids used in transient expression analysis. N, cv Nipponbare type (−1,964 bp upstream from the start codon); K, cv Kasalath type (−1,967 bp upstream from the start codon). B and C, Expression levels of the reporter GFP gene under the control of the cv Nipponbare-type OsFRDL4 promoter (p4-N; B) or the cv Kasalath-type promoter (p4-K; C) with or without the transcription factor gene (ART1) in the presence of Al. The transformed protoplasts were incubated in Murashige and Skoog medium for 17 h and then exposed to 100 μm AlCl3 for 4 h. D and E, Expression levels of the reporter GFP gene (D) and ART1 (E) under the control of p4-N or p4-K with ART1-N and ART1-K in the presence or absence of Al. The transformed protoplasts were incubated in Murashige and Skoog medium for 17 h and then exposed to 0 or 100 μm AlCl3 for 4 h. The expression levels were determined by quantitative RT-PCR. The relative expression of GFP or ART1 was normalized by DsRed as an internal control. Data are means ± sd of three (B and C) and four (D and E) biological replicates. Means with different letters are significantly different (P < 0.05 by Tukey’s test).

