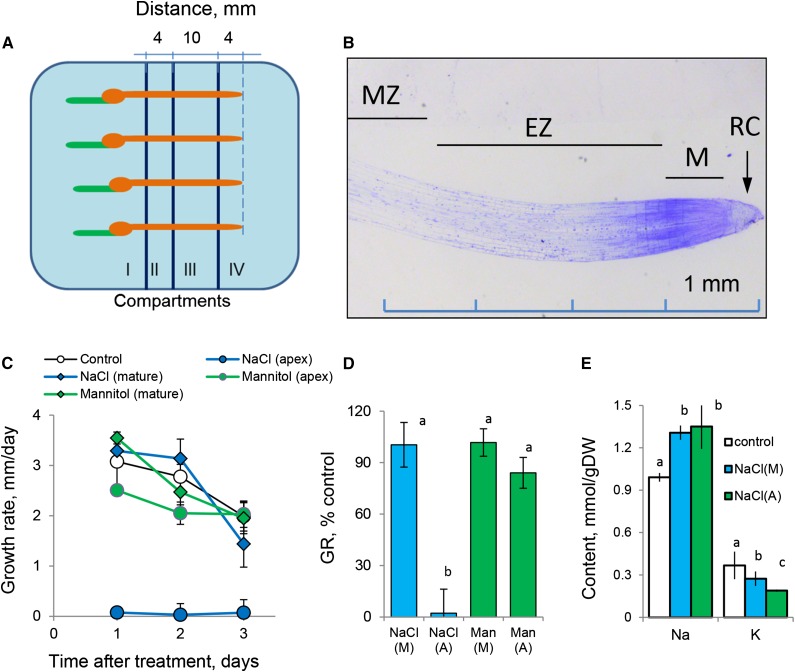
Figure 1.
Barley root growth and responses to salinity (100 mm NaCl) and isotonic mannitol treatment. A, Schematic diagram depicting the experimental design and root immobilization within a multicompartment growth chamber (Supplemental Fig. S1). Salt was added to compartments II (mature zone) and IV (root apex). B, Anatomy of the barley root apex depicting functionally different root zones (modified from Shelden et al. [2016] with permission from Oxford University Press). EZ, Elongation zone; M, meristem; MZ, mature zone; RC, root cap. C, Root growth rate as a function of time after treatment. Values shown are means ± se (n = 8–12). D, Relative growth rate (GR; % of control). E, Total root Na+ and K+ content after 3 d of 100 mm NaCl application to either apical or mature root zones. Values shown are means ± se (n = 5–8). (A), Apex; DW, dry weight; (M), mature zone; Man, mannitol. Different lowercase letters indicate significant differences between treatments at P < 0.05.

