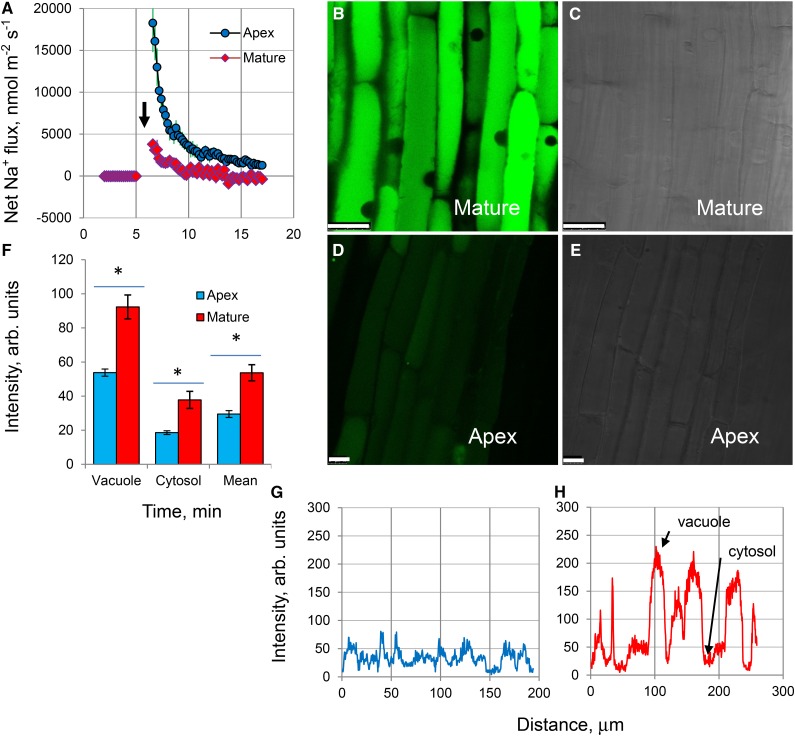
Figure 2.
Na+ uptake and accumulation in barley roots. A, Kinetics of net Na+ fluxes measured from the epidermal root cells in the apical and mature regions in response to 100 mm NaCl treatment (indicated by the arrow). Values shown are means ± se (n = 6–8). B and D, Na+ accumulation and intracellular distribution in mature (B) and apical (D) root zones visualized by the CoroNa Green fluorescent dye after 3 d of 100 mm NaCl treatment. One typical image (of eight) for each zone is shown. All images were taken using the same settings and exposure times to enable direct comparisons. C and E, Bright-field images of the corresponding zones for B and D, respectively. Bars in B to D = 25 μm. F, Mean CoroNa Green fluorescence intensity measured from cytosolic and vacuolar compartments. Values shown are means ± se (n = 70–300). Asterisks indicate significant differences between zones at P < 0.05. G and H, Typical examples of the spatial cross-sectional profiles of CoroNa Green fluorescence signals from roots in apical and mature root zones, respectively. Several lines were drawn across the so-called region of interest in an appropriate root zone, and continuous fluorescence intensity distribution profiles were obtained by LAS software and plotted.

