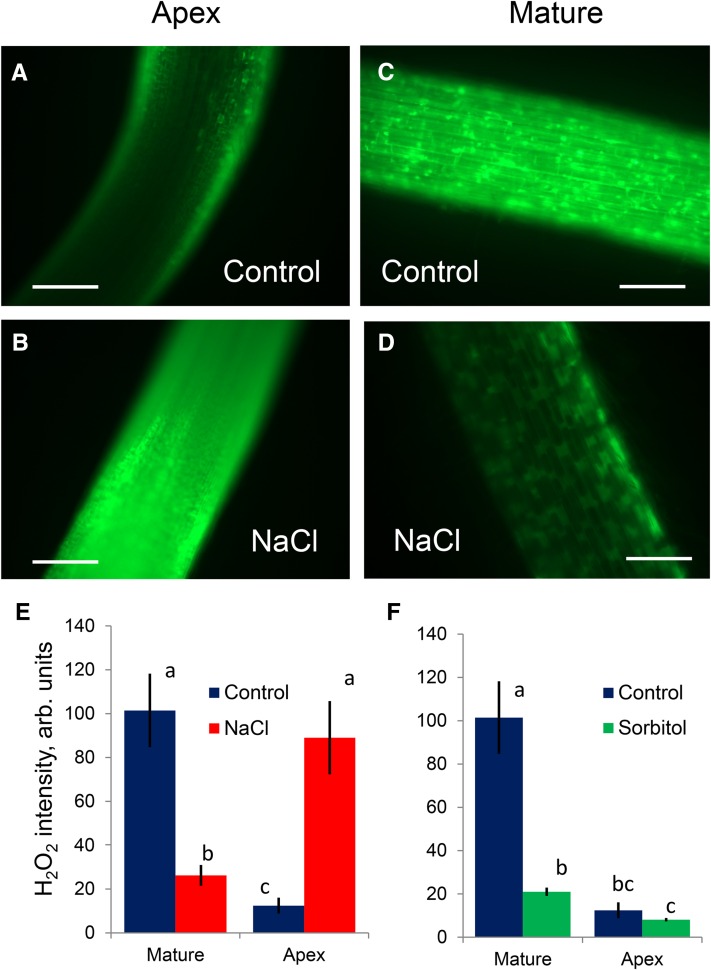
Figure 4.
Stress-induced ROS accumulation in barley roots visualized by 2′,7′-dichlorofluorescein diacetate staining (for details, see Rodrigo-Moreno et al., 2013). A to D, Representative images (out of eight) of mature (approximately 20 mm from the tip) and apical (2 mm) zones from control and salt-treated (100 mm NaCl for 24 h) roots. Bars = 200 μm. E, Average fluorescence signal intensity from the apical and mature root zones (in arbitrary units) for control and stressed roots. Values shown are means ± se (n = 8). F, As for E, but for roots treated with isotonic mannitol solution. Data labeled with different lowercase letters are significantly different at P < 0.05.

