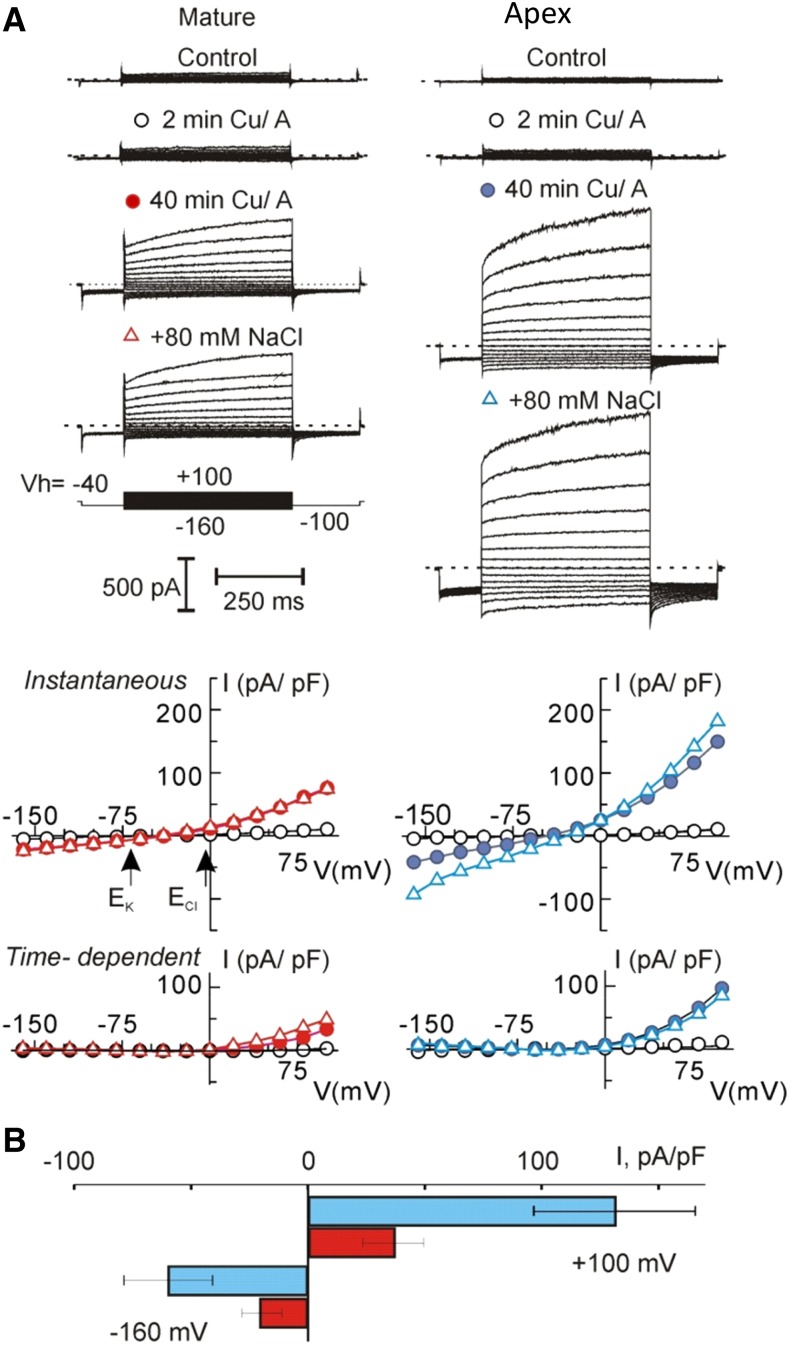
Figure 6.
ROS induced nonselective current in protoplasts from elongation and mature root zones. A, Examples of whole-cell recordings of membrane currents, induced by OH· in two protoplasts of equal size (capacitance = 5.5 pF), isolated from mature or elongation root zones. Ionic concentrations are given in “Materials and Methods.” Respective current (I)/voltage (V) curves for instantaneous and time-dependent current components at the beginning of treatment (2 min), 40 min after, and after a subsequent addition of 80 mm NaCl are presented. Arrows indicate equilibrium potentials for K+ and Cl− for standard bath and pipette solutions. Cu/A, Copper/ascorbate. B, Mean density of total (instantaneous plus time-dependent) inward and outward ROS-induced currents, measured at −160 mV and +100 mV, respectively, after 40 min of treatment in a standard bath solution. Values shown are means ± se; n = 18 and 15 for elongation and mature zones, respectively.

