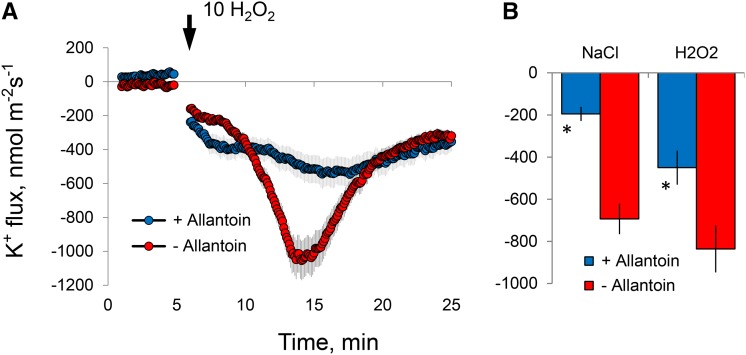
Figure 7.
Effects of root pretreatment with 1 mm allantoin (for 24 h) on K+ flux responses measured from epidermal root cells in the elongation zone upon exposure to salinity and oxidative stresses. A, Transient net K+ flux kinetics in response to 10 mm H2O2. B, Peak K+ flux values caused by acute salinity (100 mm NaCl) and oxidative (10 mm H2O2) stresses. Values shown are means ± se (n = 5–6). Asterisks indicate significant differences compared with the nonpretreated control at P < 0.05.

