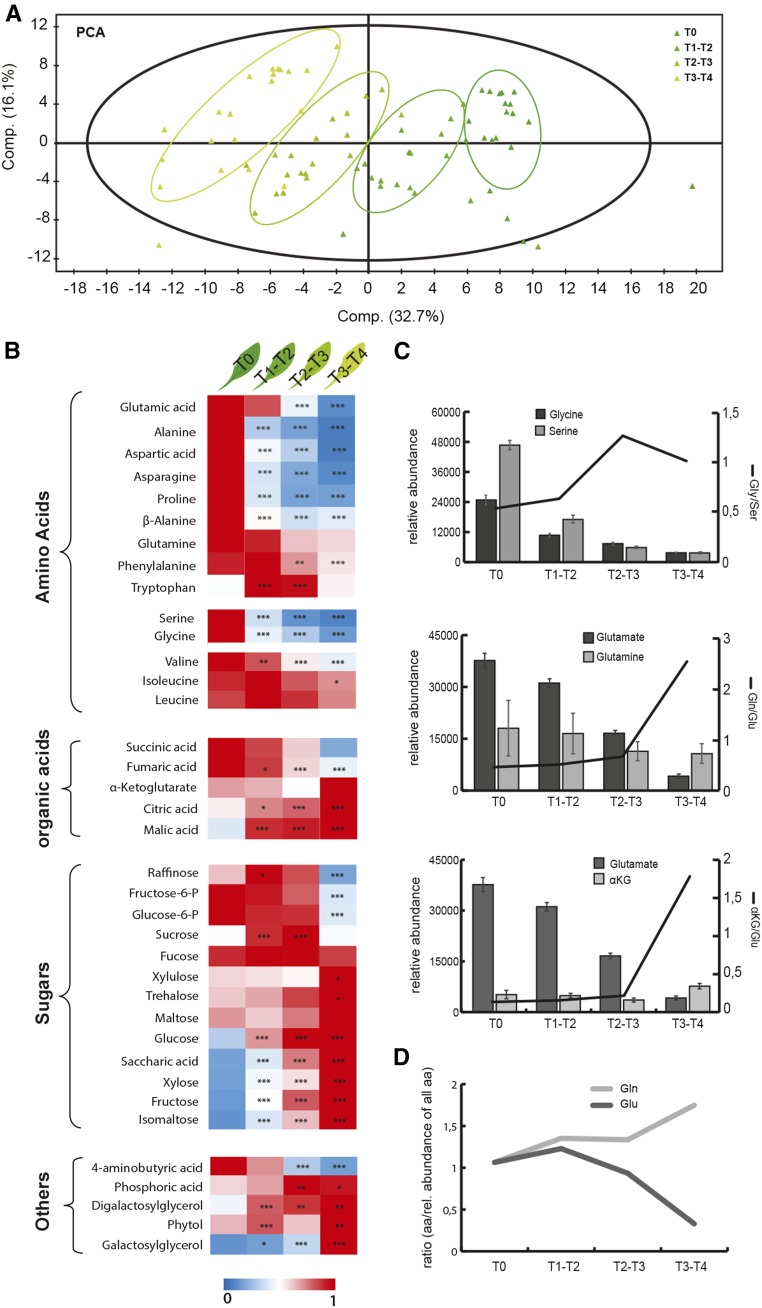
Figure 5.
Metabolomic analysis of leaves undergoing DLS. A, PCA plot of samples over the time course of leaf senescence. B, Heat map of identified amino and organic acids, sugars, and other metabolites normalized to their maximal relative abundance. Statistically significant differences in abundance compared with time point T0 were tested using Student’s t test: *, P < 0.05; **, P < 0.01; and ***, P < 0.001. C, Relative abundances and ratios of Gln-Glu, Gly-Ser, and α-KG-Glu throughout DLS. Error bars represent se. D, Ratio of Glu and Gln to the relative pool of all amino acids in senescing leaves.

