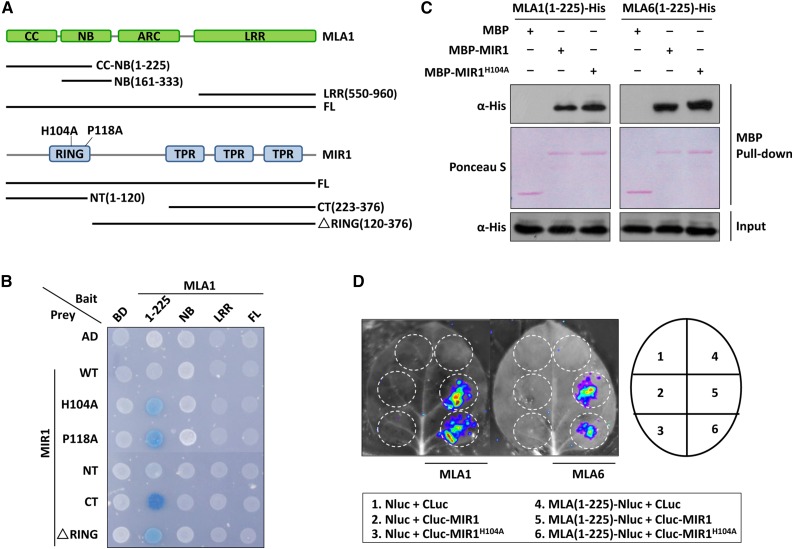
Figure 1.
MIR1 interacts with the N-terminal region of MLAs. A, Schematic diagram representing the domain structures of MLA1 and MIR1. Colored boxes represent individual domains, and fragments tested in Y2H analysis are shown as lines. The amino acid substitutions in the RING finger of MIR1 (H104A and P118A) are indicated. B, Y2H analysis of the MLA1 and MIR1 interaction. Baits of MLA1 were fused to the LexA DNA-binding domain (BD), and preys of MIR1 were fused to the B42 activation domain (AD). Colonies in blue represent positive interactions. CT, C terminus; FL, full length; LRR, Leu-rich repeat; NT, N terminus; WT, wild type. C, In vitro MBP pull-down assay for the MLA and MIR1 interaction. MBP, MBP-MIR1, and MLA-His were obtained from E. coli. MBP alone or MBP-MIR1 fusions were immobilized on amylose resin beads and incubated further with MLA fusions. Input represents equal amounts of purified MLA fusions before MBP pull down. D, LCI assay in N. benthamiana. The N-terminal half of luciferase (NLuc) was fused to MLA(1-225), and the C-terminal half of luciferase (CLuc) was fused to MIR1. Indicated fusion pairs were coexpressed in N. benthamiana by agroinfiltration. The luminescent signal was collected at 48 h post infiltration with a CCD imaging apparatus.

