Figure 3.
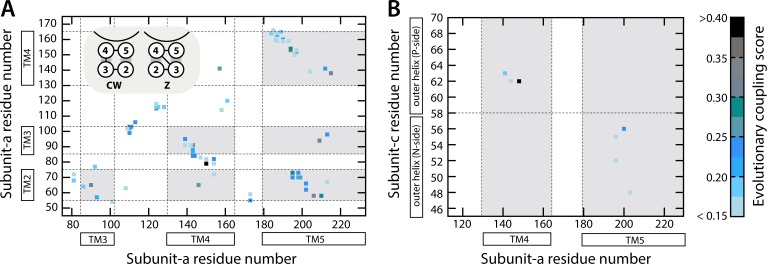
Evolutionary analysis of correlated mutations within subunit a and between subunit a and the c-ring. (A) Matrix representation of the evolutionary couplings detected between pairs of residues within subunit a; the amino acid sequence and secondary structure elements of this subunit are indicated along the x and y axes. Each element in the matrix corresponds to a specific pair of residues, color-coded according to the degree to which these residues have evolved (i.e., mutated) in a correlated manner (see color scale on the right). The transmembrane regions are shaded in gray. The two possible topologies of subunit a, given a TM4-out/TM5-in assignment, i.e., clockwise and Z-like, are schematized in the top left inset (see Results and discussion). (B) Evolutionary couplings between the outer helix of the c subunit and helices TM4 and TM5 in subunit a. The horizontal dashed line divides the c subunit outer helix in two halves, before and after the proton-binding site, one closer to the P side of the membrane and the other to the N side.

