Figure 2.
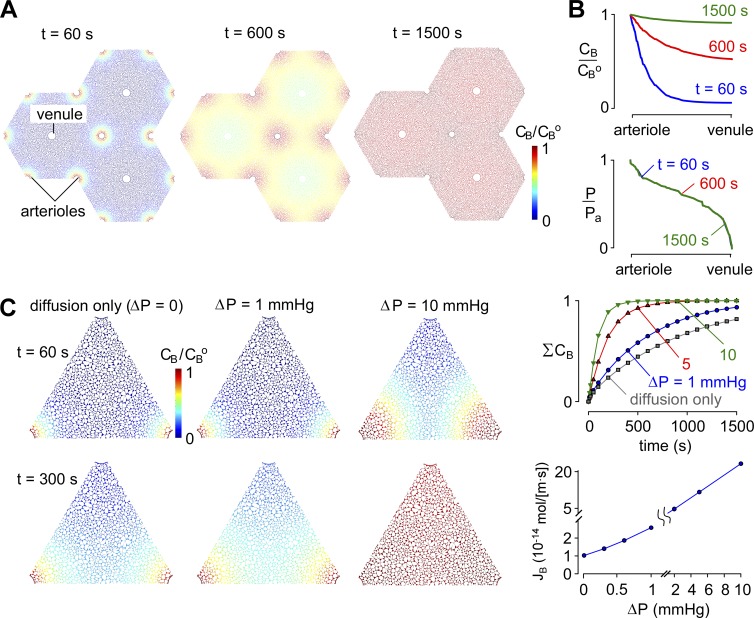
General model predictions. (A) Pseudocolored images showing tracer concentration (CB/CBo) at time = 60, 600, and 1,500 s after a step increase in para-arterial tracer concentration for ΔP = 1 mmHg, Pf = 0.04 cm/s, and D = 10−10 m2/s. (B) CB/CBo and P/Po profiles from para-arterial to paravenous space at the indicated times. (C, left) Pseudocolored images showing tracer solute accumulation in ECS after a step increase in para-arterial tracer concentration for para-arterial to paravenous pressure differences ΔP of 0 mmHg (diffusion alone) or 1 or 10 mmHg. Parameters: Pf = 0.04 cm/s and D = 10−10 m2/s. (right, top) Kinetics of tracer solute accumulation in ECS for the indicated ΔP. (right, bottom) Steady-state tracer solute transfer from para-arterial to paravenous spaces for fixed concentration (CB = 0) at the paravenous space.

