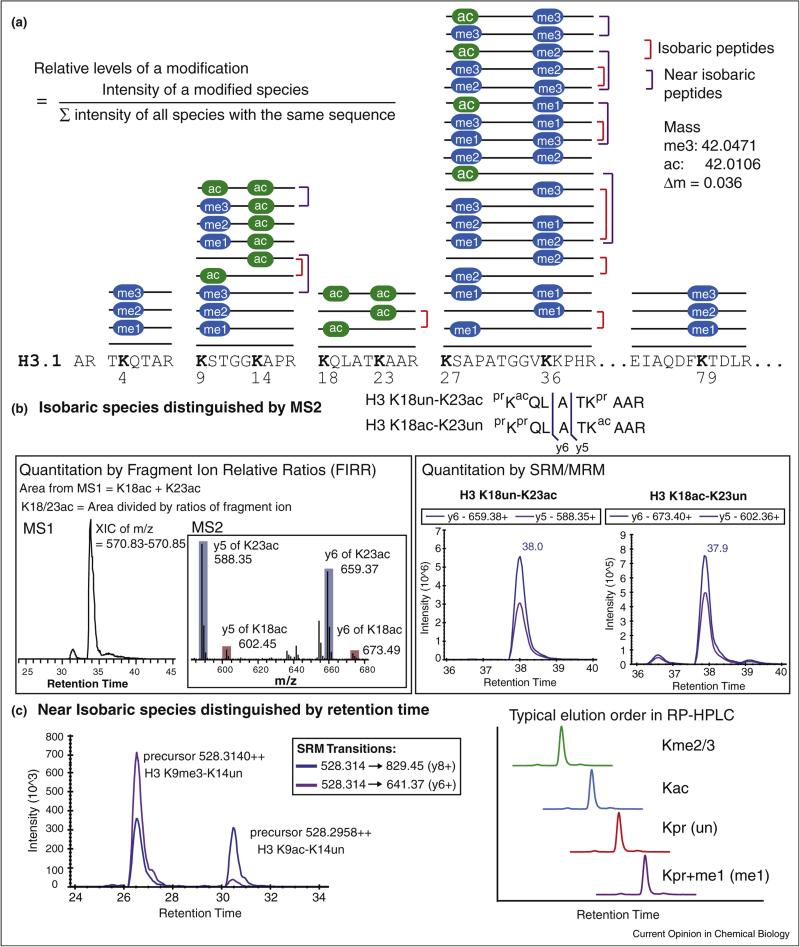
Figure 2.
Analytical challenges of analyzing histone modifications by Bottom Up and LC–MS. (a) 42 unique modified species are shown as sticks with modifications over specific residues in histone H3.1 (ac, acetylation; me, methylation). It represents a Bottom Up experiment outcome when unmodified and monomethylated lysines are blocked by chemical derivatization (e.g., propionic anhydride or deuterated acetic anhydride) before trypsin digestion. Using this workflow, eight highly-modified lysine residues in histone H3.1 (K4, K9, K18, K23, K27, K36, and K79) fall into five groups of peptides which share the same underlying sequence. The combination of modifications when two modified lysines are present in the same peptide generates isobaric species (red bracket). In addition, small mass difference between acetylation and trimethylation produce near isobaric species (purple bracket). (b) Fragment ions (such as y5 or y6) between K18 and K23 generated by tandem mass spectrometry (MS/MS or MS2) can be used to distinguish isobaric species of H3 K18un-K23ac from H3 K18ac-K23un. In the left panel, an extracted ion chromatogram of the most abundant monoisotopic peak from these doubly charged isobaric peptide species is used to determine the combined abundances, which can be further divided by fragment ion relative ratios obtained in multiplexed collision-induced dissociation (CID) tandem mass spectrum (shown in the inset) to quantify the abundance of individual isobaric species. In the right panel, SRM chromatograms of specific transitions (e.g., precursor → y5 and precursor → y6) can be used to quantify each isobaric species. Noting that data obtained by these two methods for a same sample (human multiple myeloma cell line, KMS11-TKO) is consistent to show that H3 K18un-K23ac is about 7-fold more abundant than the co-eluted H3 K18ac-K23un (retention time labeled along SRM peaks). (c) Trimethylation and acetylation are indistinguishable in low resolution instrument, such as triple quadrupole used for SRM. An example of SRM data from a human cell line (MCF-7) demonstrates that transitions designated to quantify H3 K9me3-K14un can detect two peaks. Using the retention time profile determined by synthetic peptides, these near isobaric specices (me3 vs. ac) can be distinguished.

