Fig. 3.
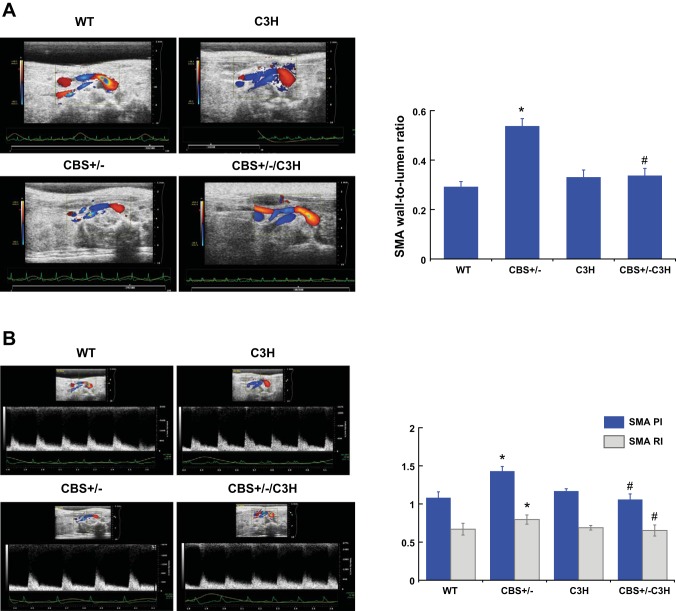
A: wall-to-lumen ratio. To assess structural changes in the superior mesenteric artery (SMA), wall thickness and lumen diameter were measured and the SMA wall-to-lumen ratio was calculated. The SMA wall-to-lumen ratio was increased in CBS+/− mice compared with WT and C3H mice. The SMA wall-to-lumen ratio of CBS+/−/C3H mice was similar to the control group. Values are means ± SE (n = 5). *P < 0.05 vs. WT. #P < 0.05 vs. CBS+/−. B: pulsatility index (PI) and resistive index (RI) of the SMA. PI and RI are calculated from blood flow velocities in the SMA during the cardiac cycle and used to determine a peripheral resistance. PI and RI of the SMA were increased in CBS+/− mice compared with WT and C3H mice. SMA PI and RI were similar to controls in mice with combined genetic HHcy and TLR-4 mutation. Values are means ± SE (n = 5). *P < 0.05 vs. WT. #P < 0.05 vs. CBS+/−.

