Fig. 3.
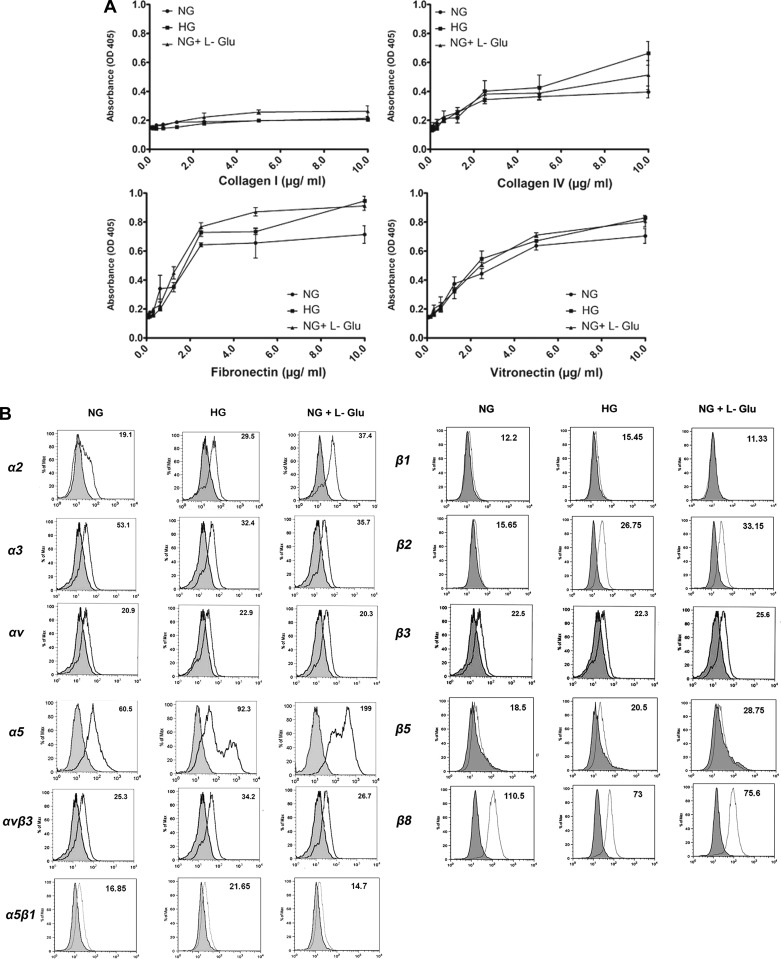
Adhesion and expression of integrins in RPE cells cultured in different glucose conditions. A: adhesion of RPE cells to collagen IV, collagen I, vitronectin, and fibronectin was determined as described in materials and methods. Please note similar adhesion of RPE cells to collagen I, collagen IV, fibronectin, and vitronectin in different glucose conditions B: expression of integrins in RPE cells. The expression of α1, α2, α3, α5, αv, β1, β2, β3, β5, β8, α5β1, and αvβ3 integrins was determined by FACS analysis as described in materials and methods. The α1 expression was not detected in RPE cells under various glucose conditions (not shown). The expression level of αvβ3 and α5, as well as β1, β2, and β5, and α5β1 were increased, while that of α3 and β8 was decreased in high glucose conditions. Although some of these changes (αvβ3, α5β1, and β1) were observed in high glucose, other changes (α5, β2, β5, and β8) were also observed under osmotic stress. These experiments were repeated with two different isolations of RPE cells with similar results.

