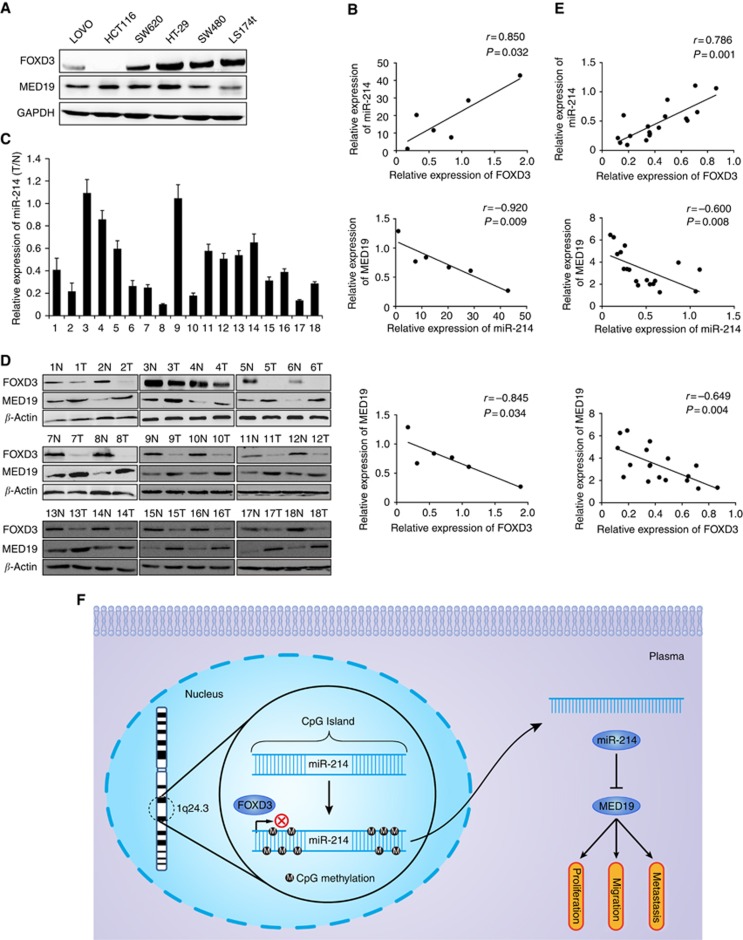
Figure 7.
Correlations of miR-214 with MED19, FOXD3 expression in CRC cell lines and tissues. (A) Western blot analysis of endogenous expression of FOXD3 and MED19 in six CRC cell lines. Expression levels were normalised to GAPDH. (B) Spearman's correlation analysis of the expression between FOXD3 and miR-214, miR-214 and MED19, FOXD3 and MED19 in six CRC cell lines. (C) Real-time PCR analysis of miR-214 expression in 18 paired primary CRC tissues (T) and matched adjacent normal mucosa (N). (D) Western blot analysis of FOXD3 and MED19 expression level in 18 paired primary CRC tissues (T) and corresponding normal mucosa (N). Expression levels were normalised to β-actin. (E) Spearman's correlation analysis of the expression between FOXD3 and miR-214, miR-214 and MED19, FOXD3 and MED19 in 18 paired CRC tissues. (F) Schematic diagram of FOXD3/miR-214/MED19 axis in the regulation of proliferation, migration and metastasis of human colorectal cancer.

