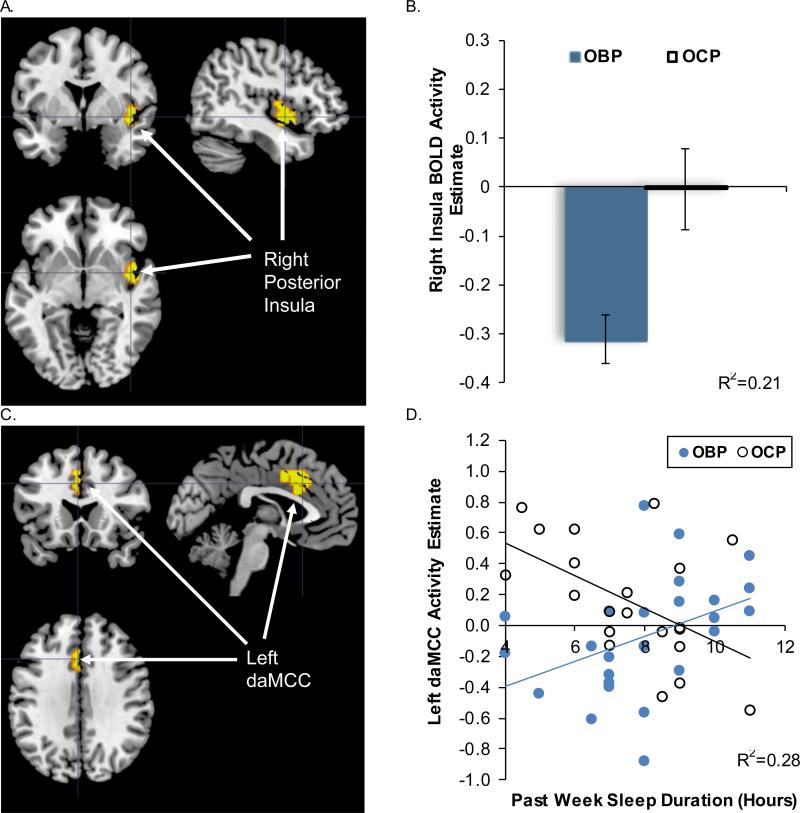
Figure 1.
SPM regression analysis testing group, sleep duration, and group*sleep duration interaction as predictors of BOLD activity to win-control within the bilateral prefrontal-striatal ROI mask. (A) Significant group effect on BOLD activity in the right posterior insula [k=57, peak voxel MNI xyz= [45, −1, −5], t42=3.52, p=.001]. (B) Extracted right insula peak BOLD activity estimates plotted by group; means and standard error bars are presented, R2 represents variance explained for the overall regression. (C) Significant group*sleep duration interaction on left daMCC BOLD activity [k=41, peak voxel MNI xyz= [−3, 17, 37], t42=3.57, p<.001]. (D) Extracted left daMCC BOLD activity estimates plotted versus sleep duration for group*sleep duration interaction, trend lines indicate simple slopes for each group, R2 represents variance explained for the overall regression. OBP = offspring of bipolar parents; OCP = offspring of control parents; daMCC=dorsal anterior mid-cingulate cortex.

