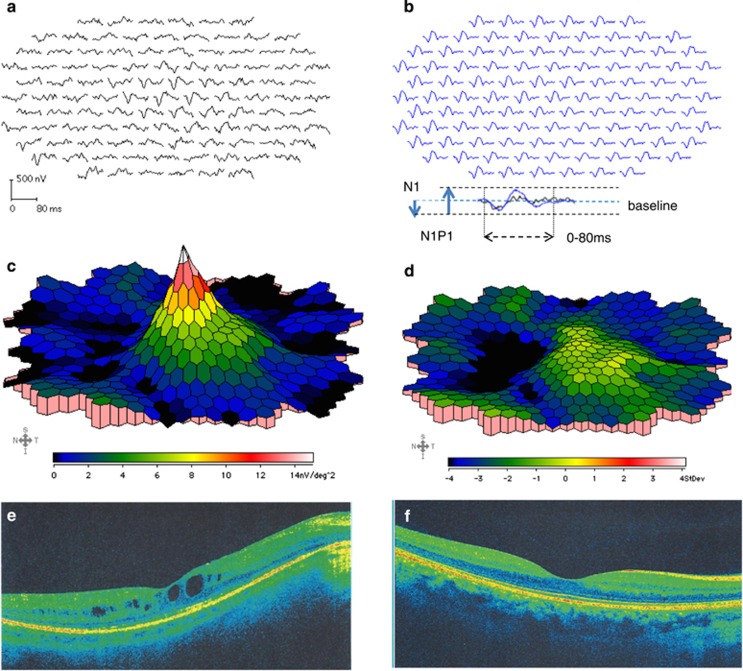
Figure 1.
Multifocal electroretinogram (mfERG) and optical coherence tomography (OCT) of a RP patient and a control. (a, b) depict mfERG tracings from the right eye of a representative RP patient (a, tracings in black) and an age-matched control subject (b, tracings in blue). The mfERGs were recorded on VERIS 6.0. The stimulus array consisted of 103 hexagons, where the central 50° of the retina were stimulated. A 3D waveform of the response density of an RP patient. Panel c represents a normal response in the center and severely attenuated responses outside the fovea. The SD of the patients' responses against those of age-matched controls is plotted in d, showing preserved responses within the PMA for RP patients. Panels e, f represent optical coherence tomography images (OCTs) from the right eye of a representative RP patient (left) and a control subject (right). The OCTs were performed on Cirrus OCT.

