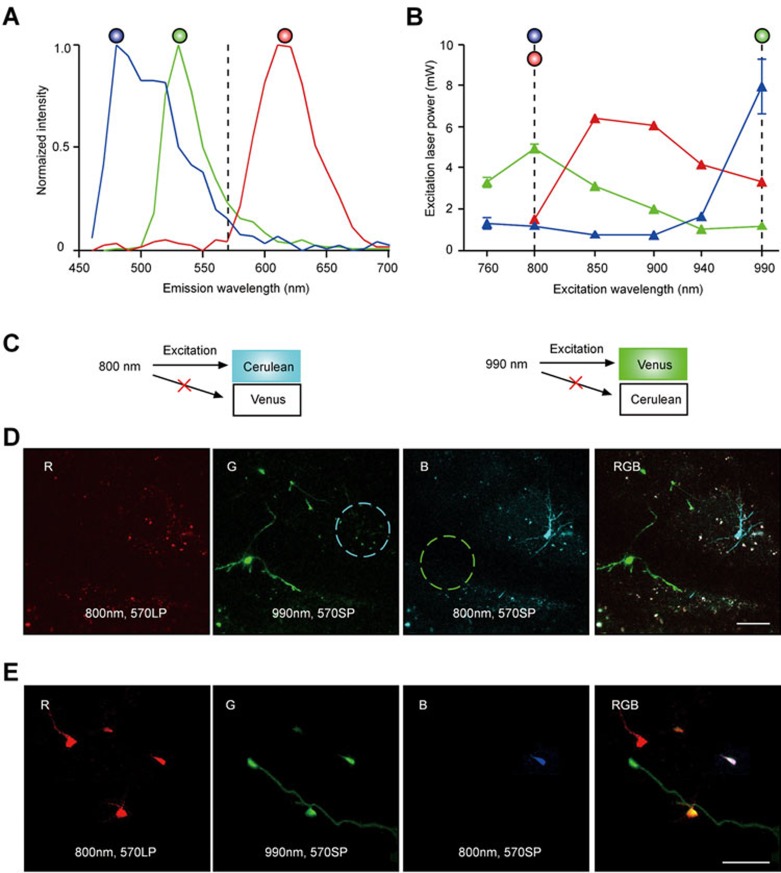
Figure 1.
Separation of fluorescence signals emitted by mCherry, Venus and Cerulean into red, green and blue channels, respectively, by means of two-photon microscopy. (A) Emission spectra of the three RGB fluorophores measured in HEK-293 cells expressing one of the three fluorophores. The spectra of mCherry, Venus and Cerulean are plotted in red, green and blue, respectively. Dashed line at 570 nm shows where the dichroic mirror splits emission light. (B) Excitation spectra of RGB fluorophores. Venus, mCherry and Cerulean were expressed separately in HEK-293 cells and the laser power that causes a given fluorescence intensity (fixed at 1 400 arbitrary units) of each FP was measured and plotted against the excitation wavelength. Color dots indicate the excitation wavelengths selected for acquisition of fluorescent signals from different FPs in this study. (C) Schematic illustration of the findings in D: 800 nm efficiently excites Cerulean but not Venus, whereas 990 nm efficiently excites Venus but not Cerulean. This provides the basis for splitting the fluorescence of the two fluorophores based on their excitation wavelength (see an example in D). (D) In vivo maximal intensity projection (MIP) images (54-82 μm, step 2 μm) showing two adult-born JGNs in the same field of view (FOV) expressing Cerulean and Venus, respectively. The red channel is empty (left most image), because there is no cell expressing mCherry in this FOV. The right most image (RGB) is a merge of the other three images. Scale bar, 50 μm. (E) MIP images (16-68 μm, step 2 μm) illustrating the fluorescent signals from a few RGB-marked adult-born JGNs acquired as described in D. Scale bar, 50 μm.

