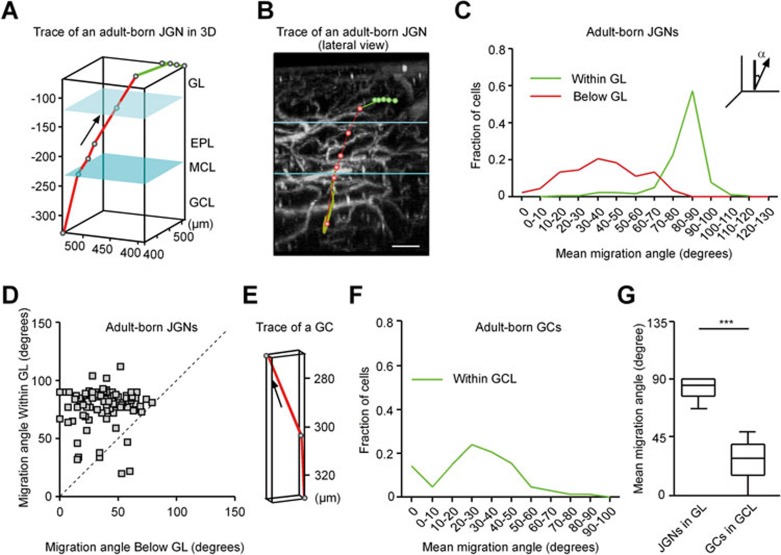
Figure 3.
Migration angles of adult-born cells in the OB. (A, B) An example migration trajectory of an adult-born JGN. The green line indicates the trace in the GL and the red line indicates the trace below the GL or upon entering the GL. EPL, external plexiform layer; GCL, granule cell layer; GL, glomerular layer; MCL, mitral cell layer. MCL is in cyan and the boundary between GL and EPL is in light cyan. The cell was false colored in grass-green color. Dots represent the cell's positions during consecutive imaging sessions. Scale bar, 100 μm. (C) Distributions of mean migration angles (α) of adult-born JGNs, as they migrate within the GL or below the GL (including entry steps into the GL); n = 225 cells for within the GL and 92 cells for below the GL, 5 mice. Migration angle is defined as the angle between vertical line and the migration vector in space (see inset). Mean migration angle for each cell is calculated based on all the migration steps of the cell within the given layer. (D) Paired comparison of mean migration angles of the individual JGNs below and within the GL (n = 92 cells, 5 mice). Each data point represents one cell with complete migration history. The dashed line is the identity line (x = y). (E) An example migration trajectory of an adult-born GC. (F) Distribution of mean migration angles of adult-born GCs migrating in the GCL (n = 144 cells, 5 mice). (G) Box plot comparing mean migration angles of JGNs in the GL and GCs in the GCL (values are shown as median ± interquartile range; n = 225 JGNs, 144 GCs from 5 mice; ***P < 0.001, Mann-Whitney test).

