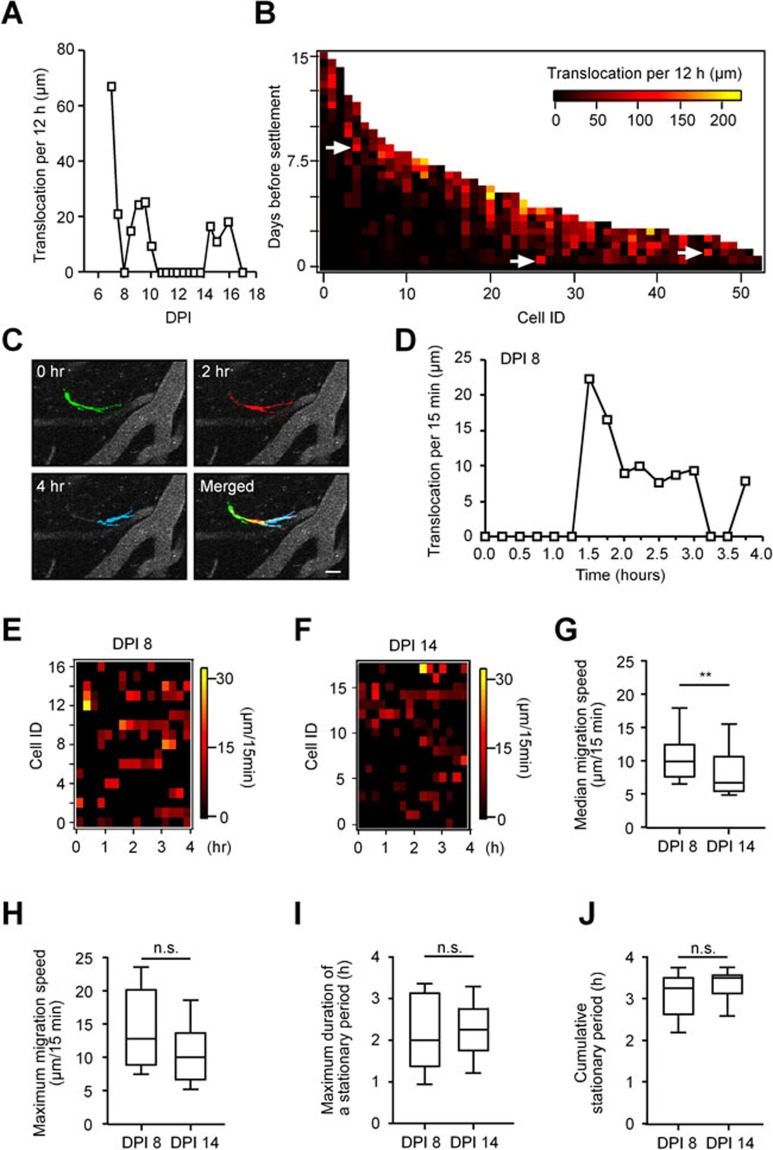
Figure 4.
Temporal migration pattern of adult-born JGNs. (A) Migration speed (translocation per 12 h) of an example adult-born JGN plotted against time (DPI). Note the stop-and-go behavior of the cell. (B) 2D plot of the migration speed for adult-born JGNs, which settled down within the FOVs (n = 62 cells, 5 mice), on different days before their settlement. Arrows point to the high speed phase of a few JGNs. (C) False-colored single-frame images of an adult-born JGN and surrounding blood vessels (DPI 8, 30 μm below the dura) taken at different time points as indicated (see timestamp, relative time). Scale bar, 20 μm. (D) Distance traversed by the cell shown in C during consecutive 15-min-long time intervals plotted as a function of time. (E, F) 2D plots of the migration speed (translocation per 15 min) of adult-born JGNs on DPI 8 (E, n = 17 cells, 5 mice) and on DPI 14 (F, n = 18 cells, 4 mice). (G, H) Box plots showing the median migration speed (G) and maximum migration speed (H) of cells shown in E and F. Median migration speed was significantly different between the two age groups (Mann-Whitney test, **P ≤ 0.01). No significant difference was found between the two groups in terms of maximum migration speed (P = 0.1). (I) Box plot showing the maximum duration of a stationary period during the period of 4 h. No significant difference was found between DPI 8 and DPI 14 (Mann-Whitney test, P = 0.8). (J) Box plot showing the cumulative stationary period for each cell during the 4-h-long observation time window. No significant difference was found between DPI 8 and DPI 14 (Mann-Whitney test, P = 0.2). In G-J, all values are shown as median ± interquartile range. Data shown in E-J belong to the same data set.

