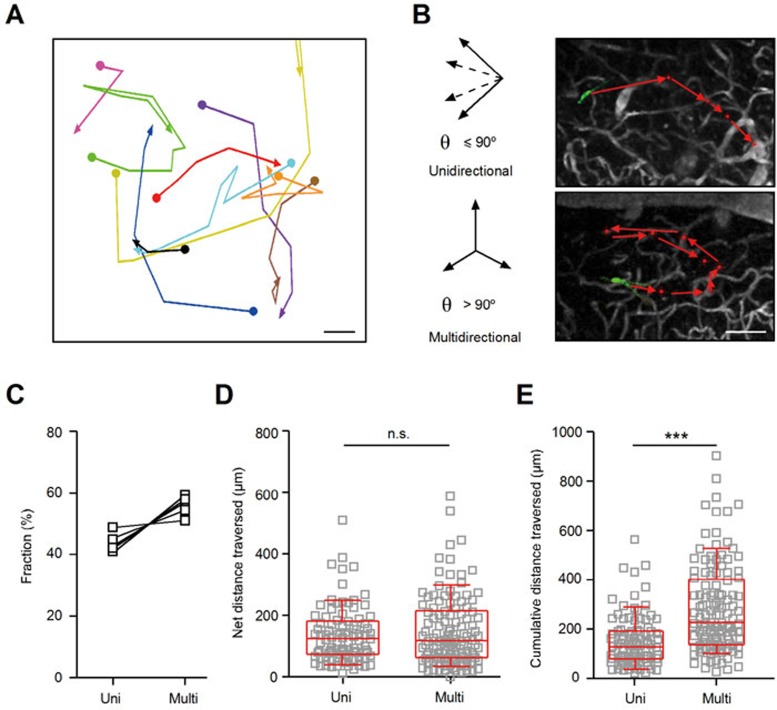
Figure 5.
Spatial migration pattern of adult-born JGNs. (A) Migration history of 10 JGNs in an example FOV (top view). Each trace is shown in a different color. Scale bar, 50 μm. (B) Examples of two different types of migration trajectories of adult-born JGNs. Upper: unidirectional migration, the maximal migration angle (θ) between the two immediately adjacent migration steps is ≤ 90°. Lower: multidirectional migration, θ > 90°. Scale bar, 100 μm. (C) Fraction of uni- or multidirectionally migrating cells (n = 5 mice, 15-69 cells per mouse). Solid lines connect the data obtained in the same animal. (D) Comparison of net migration distance (distance between the entry sites into the GL and the final cell's position) between unidirectional and multidirectional JGNs (n = 93 and 120 cells, respectively, 5 mice). No significant difference was found by Mann-Whitney test (P = 0.99). (E) Comparison of total migration distance (the cumulative distance traveled in GL) between unidirectional and multidirectional cells (n = 93 and 120 cells, respectively, 5 mice). Significantly longer cumulative distances were found for cells with multidirectional migration; ***P < 0.001, Mann-Whitney test. All values are shown as median ± interquartile range.

