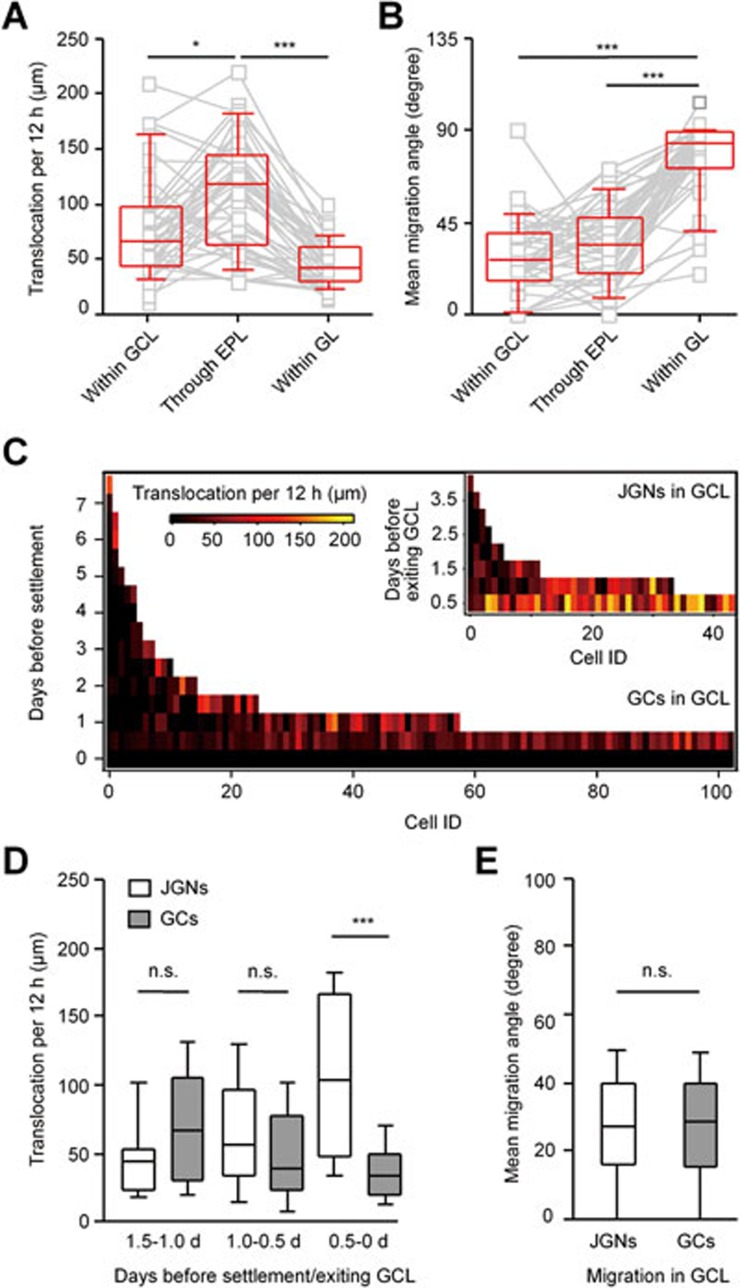
Figure 6.
Adult-born neurons show different migration speed across layers of the OB. (A) Comparison of median migration speed of the same JGNs in different layers of the OB. Paired data were obtained from the same cells migrating Within GCL, through EPL (between MCL and GL) or within GL (n = 43 cells with recorded trace inside GCL, 4 mice, **P < 0.05, ***P < 0.001, Kruskal-Wallis test followed by Dunn's multiple comparison test). Here and in B for cells, which made more than one migration step within the layer, the entries represent the mean values. (B) Comparison of mean migration angles measured as cells migrated through different layers of the OB. Same data set as in A; ***P < 0.001, Kruskal-Wallis test followed by Dunn's multiple comparison test. (C) 2D plots of the migration speed (translocation per 12 h) of JGNs and GCs in the GCL on different days before settlement (for GCs) or before leaving GCL (n = 43 JGNs, 4 mice, and 103 GCs, 5 mice). (D) Comparison of migration speed of JGNs and GCs on different time points before exiting GCL (for JGNs) or settlement (for GCs). Same data set as in C; P = 0.3 (Mann-Whitney test) for comparison between the JGNs and GCs on 1.5-1.0 d; P = 0.1 on 1.0-0.5 d and ***P < 0.001 on 0.5-0 d. (E) Migration angles of JGNs and GCs in GCL; P = 1.0, Mann-Whitney test; for JGNs, n = 43 from 4 mice; for GCs, n = 144 from 5 mice. Values are shown as median ± interquartile range.

