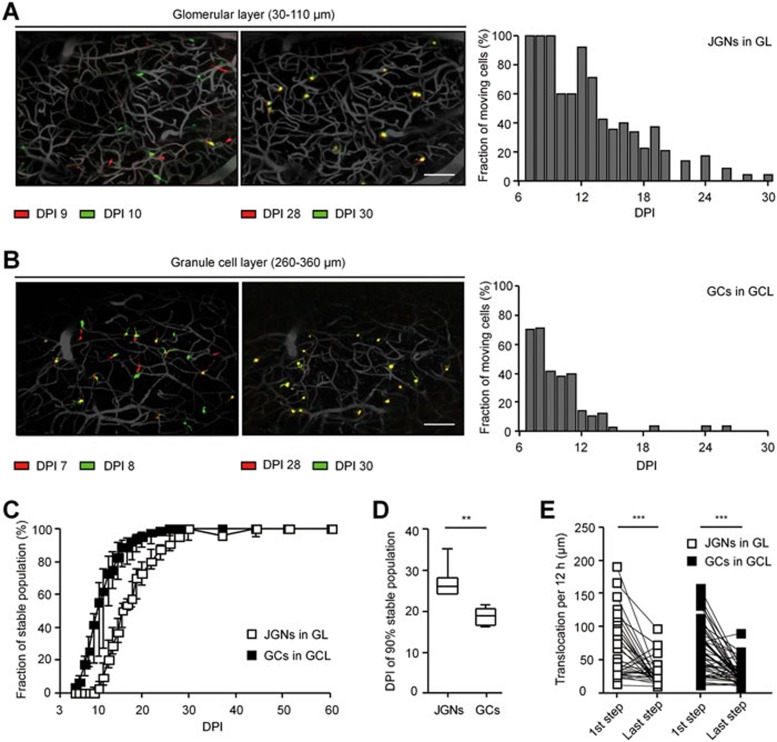
Figure 7.
Motility of adult-born cells gradually decreases with time spent in the destination layer. (A) Overlay of adult-born JGN positions recorded at DPI 9 and DPI 10 (left), as well as at DPI 28 and DPI 30 (middle). MIP images from 30 to 110 μm, step 2 μm. Scale bar, 100 μm. Right: a graph showing the fractions of moving cells at different DPIs. (B) Similar data as in A but obtained for adult-born GCs. MIP images from 260 to 360 μm, step 2 μm. Scale bar, 100 μm. (C) The fraction of stable cells plotted as the function of time (DPI). Median with one interquartile range is shown on each time point (n = 6 FOVs from 4 mice for GCs and n = 11 FOVs from 4 mice for JGNs). (D) Box plot illustrates the day when accumulation of 90% of the stable population is achieved. All values are shown as median ± interquartile range. Same data set as C, **P < 0.01, Mann-Whitney test. (E) Paired comparison of the first and the last migration steps of individual adult-born JGNs (n = 32 cells, 5 mice) and GCs (n = 48 cells, 5 mice) in their destination layers; ***P < 0.001, Wilcoxon matched pairs test. The median size of the first and the last step was also compared between JGNs and GCs. Mann-Whitney test, P = 0.9 and 0.8, respectively.

