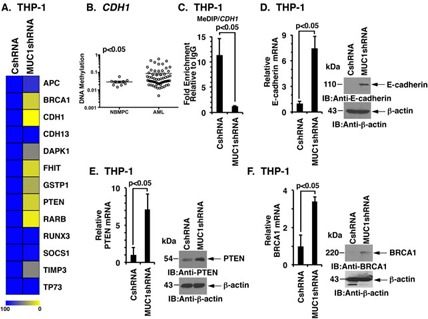
Figure 5. MUC1-C regulates DNA methylation in AML cells.

A. Heatmap showing relative methylation levels of the indicated TSG promoters in THP-1/CshRNA and THP-1/MUC1shRNA cells. B. The GSE58477 dataset from GEO was analyzed to assess the methylation of CpG islands in the CDH1 gene promoter in AML cells (n = 62) as compared to normal bone marrow progenitor cells (NBMPCs) cells (n = 10). The open circles indicate the β-value in the logarithmic scale. The horizontal bars indicate mean±SEM and p < 0.05 indicates statistical difference in the mean. C. The CDH1 promoter in the indicated THP-1 cells was analyzed for CpG methylation using the MeDIP assay. The results (mean±SD of three determinations) are expressed as the relative fold enrichment compared with that obtained with the IgG control. D. The indicated THP-1 cells were analyzed for E-cadherin mRNA levels by qRT-PCR (left). The results are expressed as a relative E-cadherin mRNA levels (mean±SD of three determinations) as compared to that obtained with CshRNA cells (assigned a value of 1). Lysates from THP-1/CshRNA and THP-1/MUC1shRNA cells were immunoblotted for indicated antibodies (right). (E-F) The indicated THP-1 cells were analyzed for PTEN E. and BRCA1 F. mRNA levels by qRT-PCR (left). The results are expressed as a relative mRNA levels (mean±SD of three determinations) as compared to that obtained with CshRNA cells (assigned a value of 1). Lysates from THP-1/CshRNA and THP-1/MUC1shRNA cells were immunoblotted for indicated antibodies (right).
