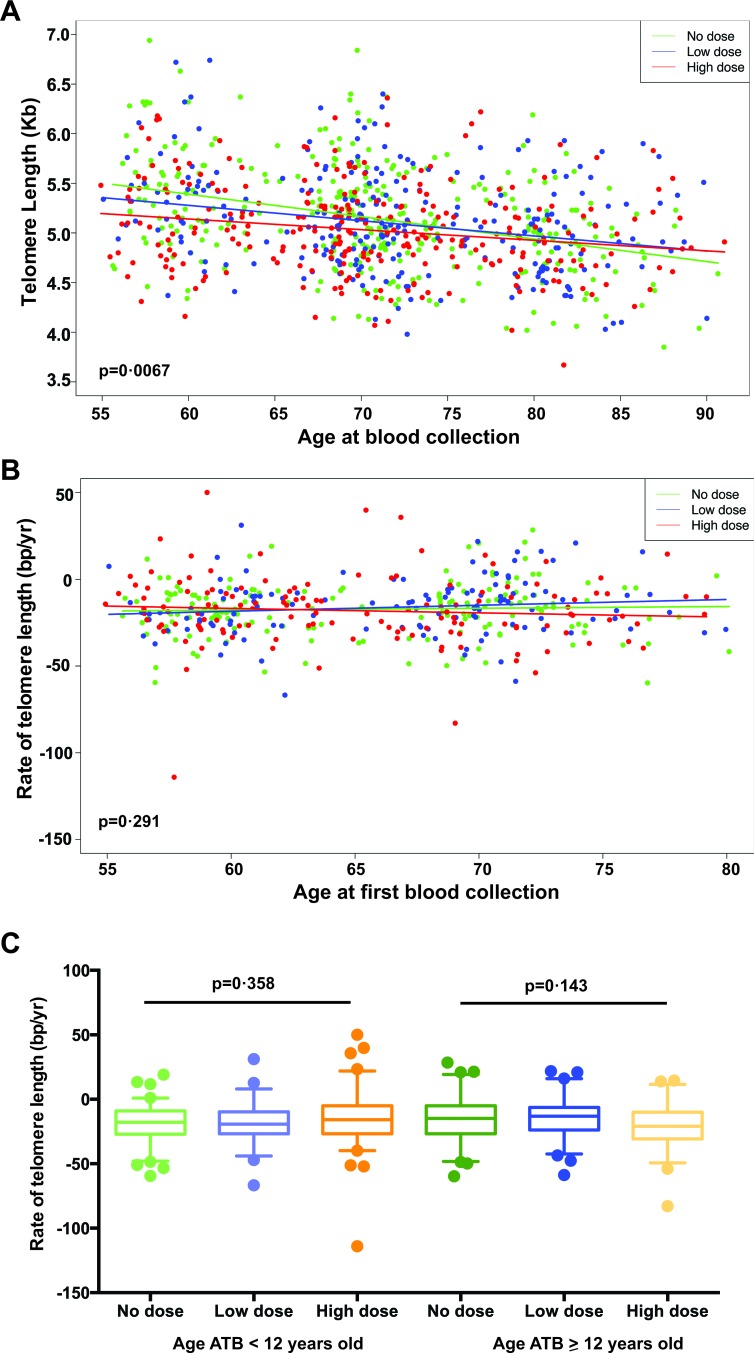
Figure 2. Telomere length change versus age in all study subjects.
A. Scatterplot of telomere length versus age at blood collection for all subjects (healthy plus ill), and with data for both visits reflected (i.e. 2 points per subject). There is a significant interaction effect with differential relationships between telomere length and age for the different dose groups (p = 0.0067). B. Scatterplot of the average annual rate of change in telomere length between the first and second visits versus the age at the first visit for all subjects. There is no significant interaction effect to differentiate relationships between telomere length change and age by dose groups (p = 0.29). C. Boxplots of the average annual rate of telomere length change with age for all subjects by subject age at the time of the bombing (age ATB < 12 vs. ≥ 12 years old) and by dose groups. No interaction effects were detected for either age < 12 or ≥ 12 years old ATB (p for trend = 0.358 and 0.143, respectively).

