
Figure 1.
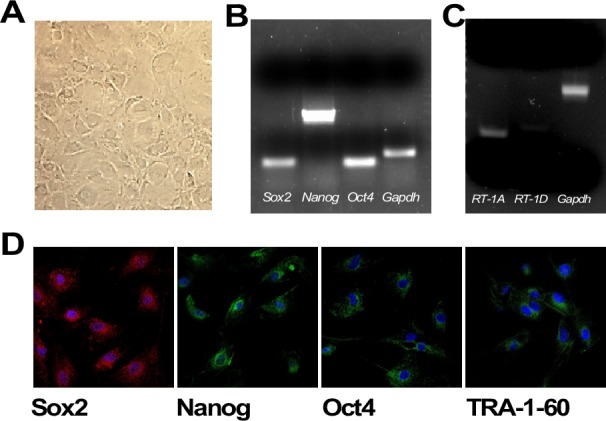
A. Plated rat amniotic epithelial cells (AECs) show the classical flat, epithelial phenotype (5x magnification). B. RT-PCR analysis of the pluripotent markers Oct4, Nanog and Sox2. C. RT-PCR of the MHC-I and MHC-II markers (RT-1A and RT-1D, respectively). D. Immunofluorescence of the pluripotency markers Sox2, Nanog, Oct4 and TRA-1-60. Nuclear counterstaining with DAPI is depicted in Blue (63x magnification).