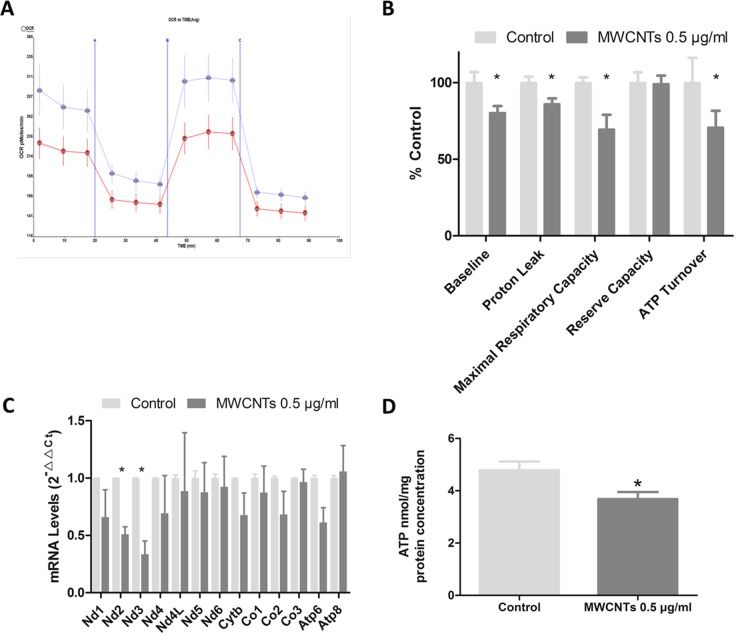
Figure 4. The mitochondrial functions after MWCNTs exposure to GC-2spd cells.
A. Effects of MWCNTs on cellular OCR (oxygen consumption rate) were measured with the XF96 Extracellular Flux Analyzer. GC-2spd cells were respectively incubated with control or 0.5 μg/mL for 24h. Three inhibitors, oligomycin (1 μM), FCCP (0.75 μM) and antimycin A/rotenone (0.5 μM each), were added at the different stage. The four periodes represent cellular endogenous rate, ATP-synthase-inhibited rate maximal uncoupled rate, and rotenone- and antimycin-A-inhibited rate. The results were normalized with cell protein levels. The blue and red lines respectively represent control and treated with 0.5μg/mL MWCNTs. B. Quantitative histogram of OCR results. C. RT-qPCR analysis of the expression of genes between two groups in GC-2spd cells. The 18S rRNA was used as internal control. D. The ATP levels of GC-2spd cells detected by fluorescence reaction approach, adjusted by cell protein levels. *, p value < 0.05. Values were expressed as means ± S.E. from three separate experiments.

