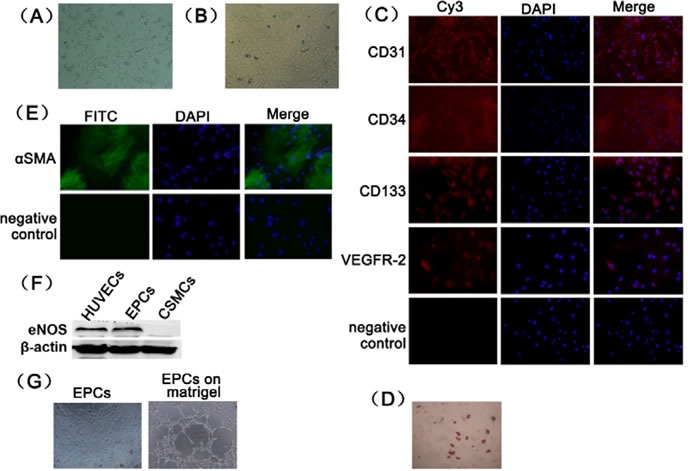
Figure 1. Primary culture and characterization of rat EPCs.

(A) Rat BM-MNCs from bone marrow after 7 days in culture (100×). (B) Rat BM-MNCs after 14 days of culture (100×). (C) CD31, CD34, CD133 and VEGFR-2 expression was detected using immunofluorescence (200×). (D) EPCs differentiation potential into adipocytes was demonstrated using oil red-O staining (100×). (E) EPCs differentiation potential into smooth muscle cells was demonstrated using immunofluorescence staining (200×). (F) The expression of eNOS in EPCs was identified using Western blotting analyses. Human umbilical vein endothelial cells was used as positive control. Cavernous smooth muscle cells was used as negative control. (G) Tube formation assay was examined microscopically (100×).
